Tableau Grouping is the process of merging or combining two or more values for further analysis. For example, When we see products by region report, we may find a few underperforming products. Sometimes, it may be annoying to see all those underperforming products. So, we have to perform Tableau grouping on those records (combining those records) and display them as one product in a report.
With two examples, this article will show you how to perform grouping or create groups in Tableau reports. We will use the report we created in our previous article for this Tableau Grouping demo.
Please visit the Data Labels in Reports article to understand the Data Source and the Tableau report. The below screenshot will show you the report preview. The custom SQL query that we are going to use for this Tableau Groups report is:
SELECT ProdCat.EnglishProductCategoryName,
       ProdSubCat.EnglishProductSubcategoryName,
       Geo.EnglishCountryRegionName,
       Geo.StateProvinceName,
       Geo.City,
       Geo.PostalCode,
       Geo.IpAddressLocator,
       Prod.EnglishProductName,
       Prod.Color,
       Prod.DealerPrice,
       Cust.FirstName,
       Cust.LastName,
       Cust.Gender,
       Cust.YearlyIncome,
       Cust.EnglishEducation,
       Cust.EnglishOccupation,
       Fact.OrderQuantity,
       Fact.TotalProductCost,
       Fact.SalesAmount,
       Fact.TaxAmt,
       Fact.OrderDate
FROM DimProductSubcategory AS ProdSubCat
   INNER JOIN
     DimProduct AS Prod ON ProdSubCat.ProductSubcategoryKey = Prod.ProductSubcategoryKey
   INNER JOIN
     DimProductCategory  AS ProdCat ON ProdSubCat.ProductCategoryKey = ProdCat.ProductCategoryKey
   INNER JOIN
     FactInternetSales AS Fact ON Prod.ProductKey = Fact.ProductKey
   INNER JOIN
     DimCustomer AS Cust ON Fact.CustomerKey = Cust.CustomerKey
   INNER JOIN
     DimGeography AS Geo ON Cust.GeographyKey = Geo.GeographyKey
If you observe the below screenshot, the Data we highlighted, such as Multi, NA, and White color products, are not performing well in all the country regions. So, let’s use Tableau grouping to Group them.
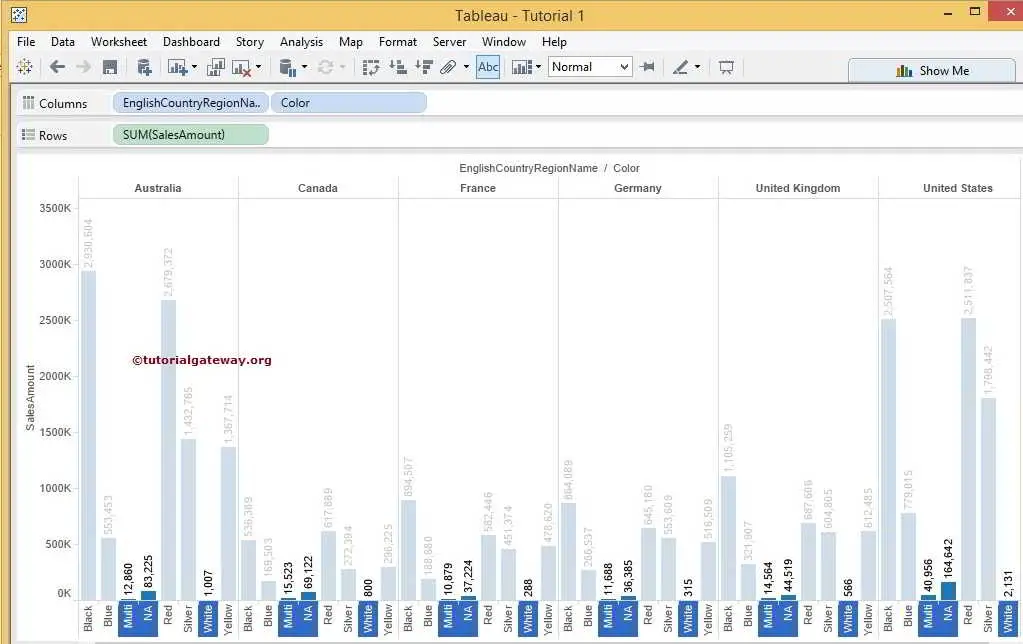
Tableau Grouping Method
In Tableau, we can perform Grouping in multiple ways. In the first method, a tooltip, like a window, will display when you select the various records or values from the report. From that, Please Click the Group Members button, as shown in the screenshot below.
Once you click on the button, tableau will automatically group those items. That’s it. We have done this. Here, we could not see the Axis labels, so let us flip or rotate the chart.
You can see the products.
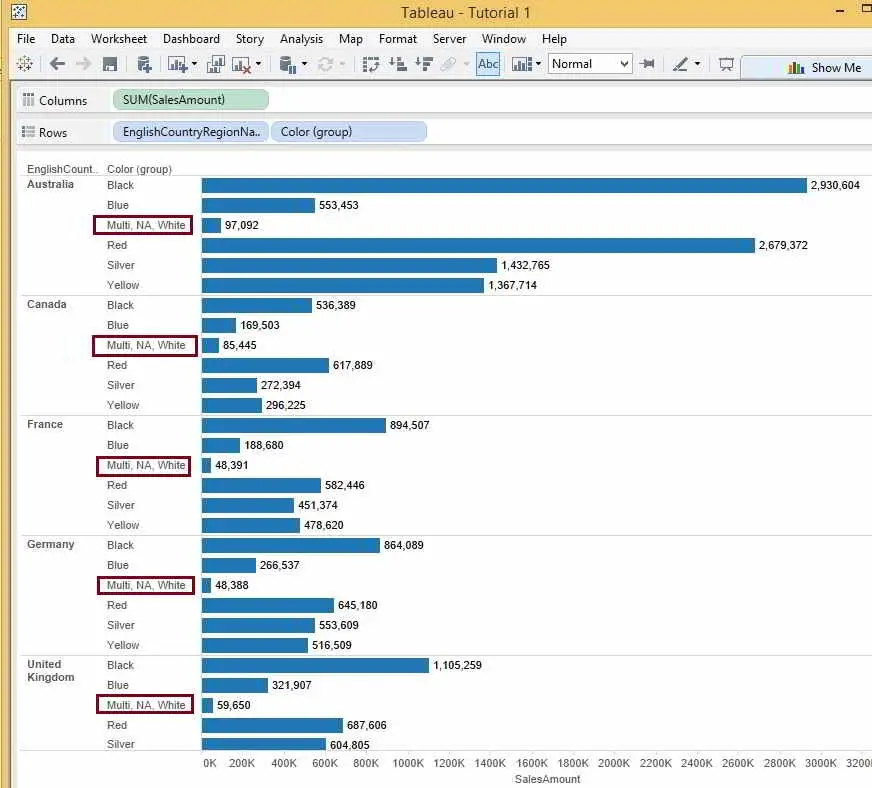
Tableau GroupBy Example 2
It is a simple bar chart to demonstrate the creation of a Tableau Group. First, Drag and Drop the Color from the Dimension Region to the Rows Shelf and the Sales Amount from the Measures region to the Columns Shelf.
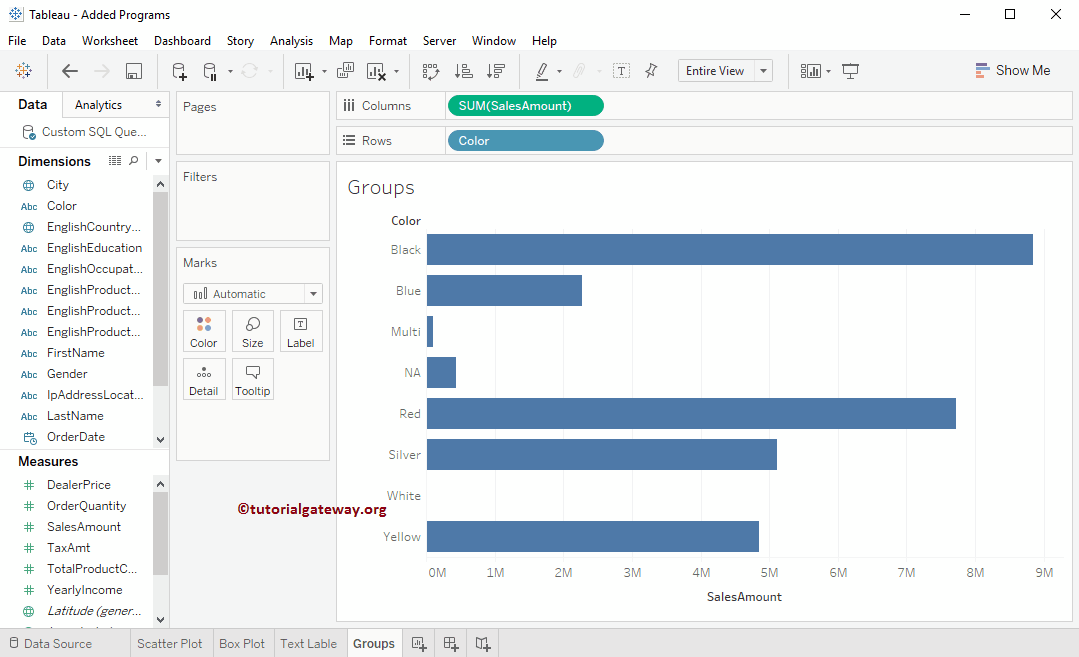
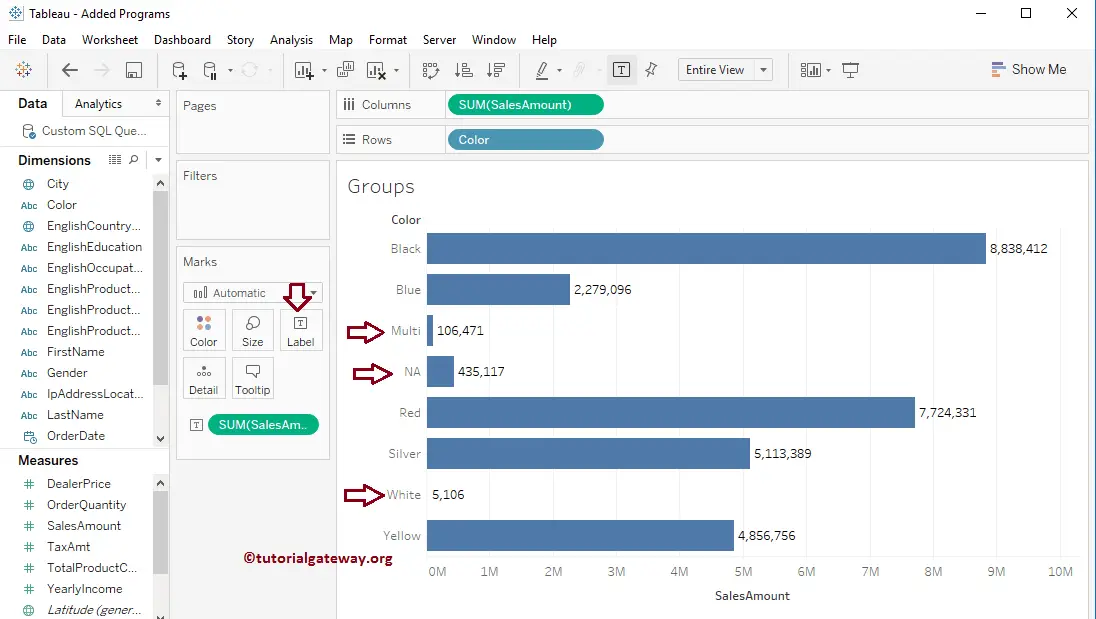
From the above screenshot, you can see that the intelligence has drawn the bar chart. Let us add the labels to each bar so that we can see the total amount of sales that happened for each color. For this, drag and drop the Sales from the Measures region to the label section present in the Marks Shelf.
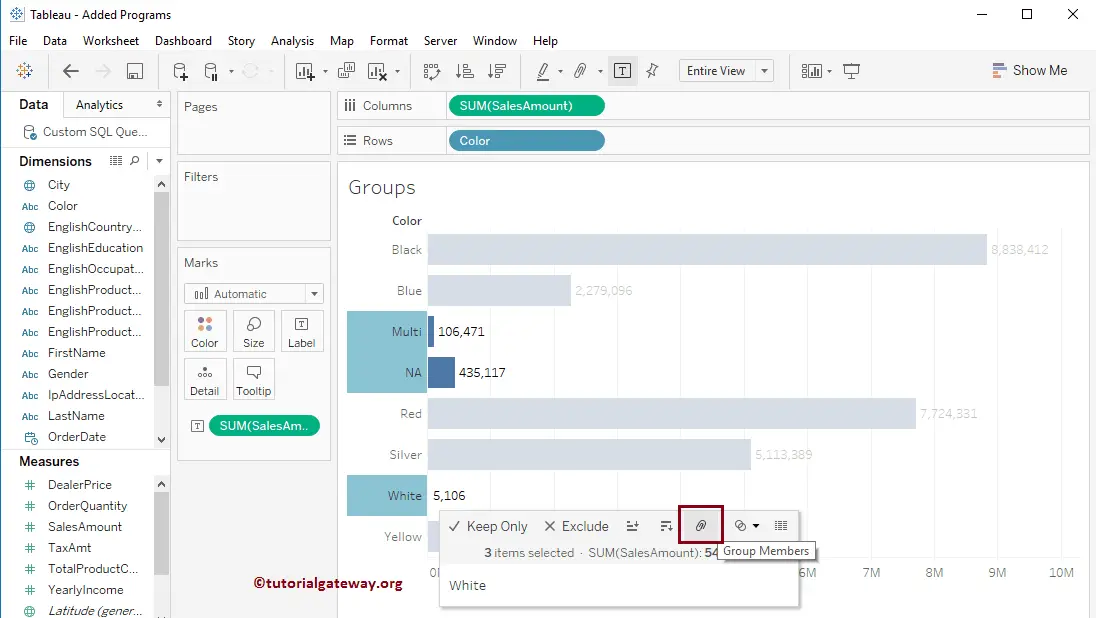
From the Tableau screenshot below, you can observe very few sales for Multi, NA, and White color products, so let us group (groupby) those low-performed products as one.
To create groups in the tableau, select the groupby members you want to include in your category. Next, select the Icon in the tooltip representing the Group members option.
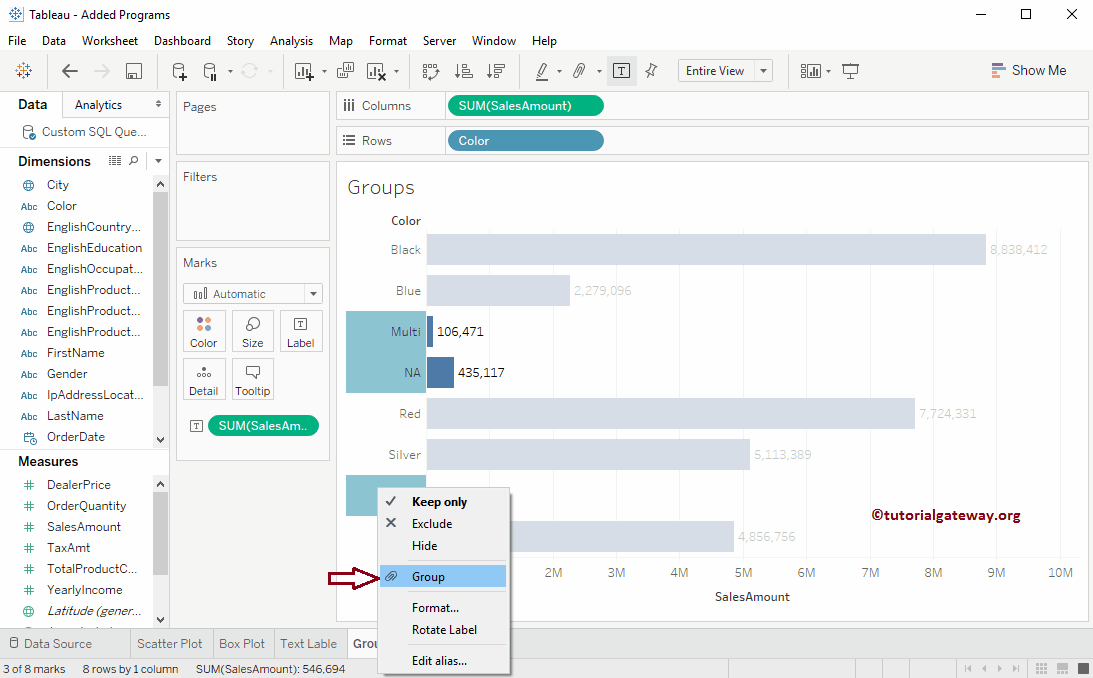
Create Tableau Group using the Axis
Please select the members you want to include in your set by holding the CTRL or SHIFT button and right-clicking on them will open the context menu. Please select the Group option.
Now you can see our newly created Group in the Tableau design area with groupby members.
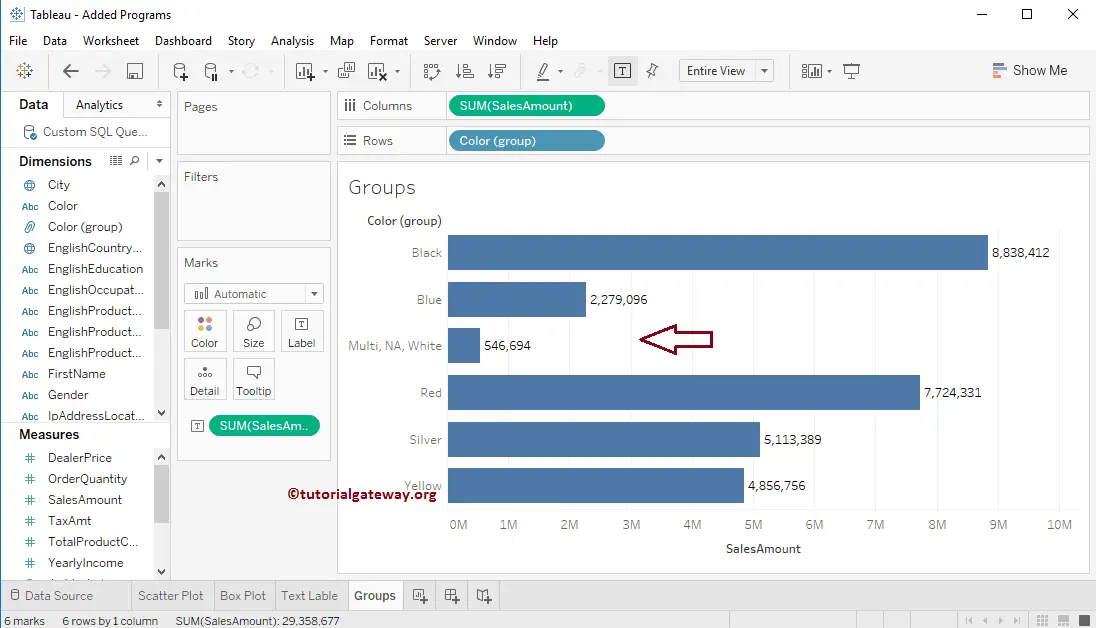
Tableau Grouping from the Toolbar
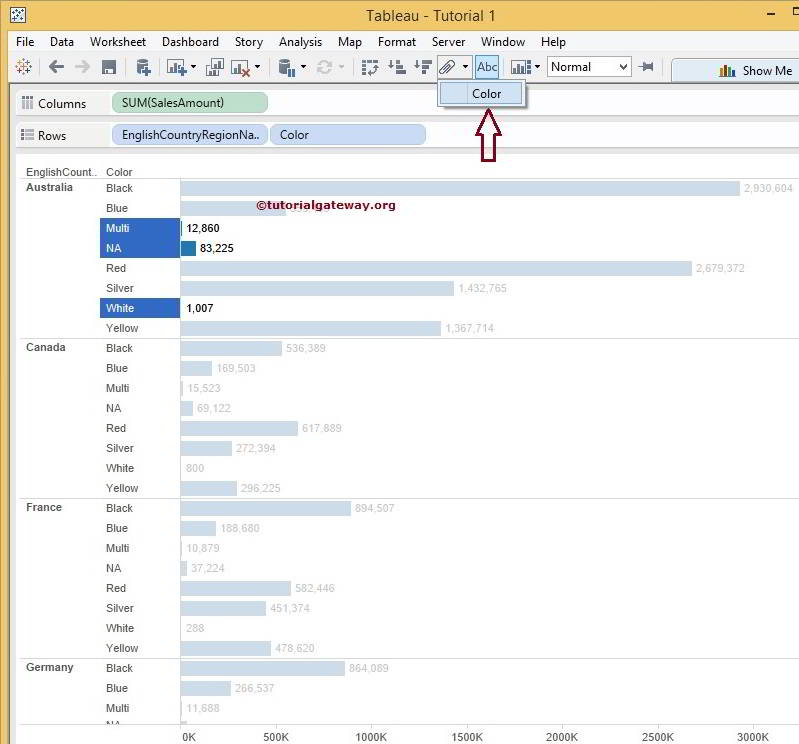
The second method for Tableau grouping is using Toolbar options. Select the columns you want to unite and click the Group button in the toolbar. The screenshot below shows that when you hover on the button, it will show the tooltip.
Once you click the button, Tableau will show you that it will create a new Group Color. From the screenshot below, you can observe that We successfully created the color group. You can see that name in the Rows Card.
Change Tableau Grouping Name
Within the Axis bar, Right-click on the newly created members and select the Edit Alias.. option from the context menu.
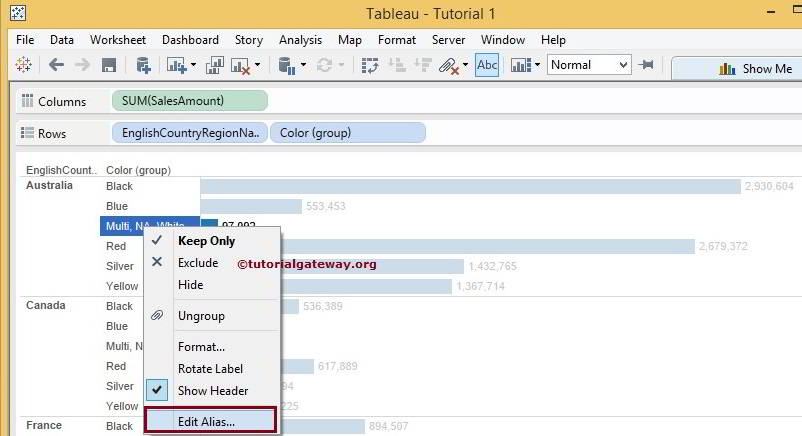
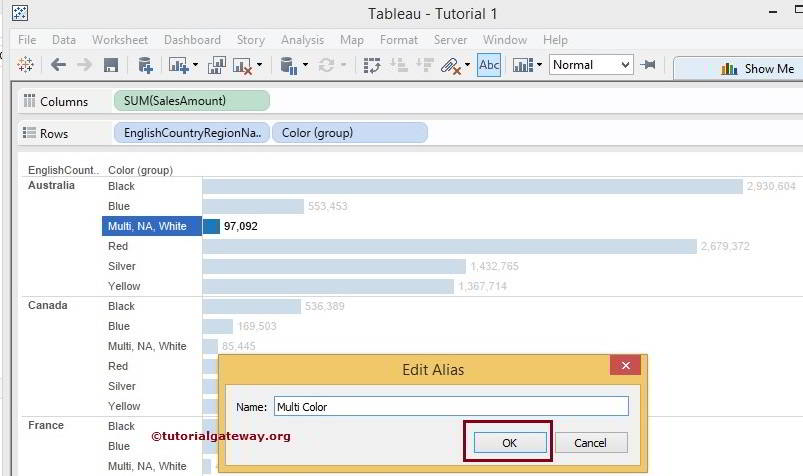
Once you choose the Edit Axis.. option, the following window will be opened to change or alter the Group name.
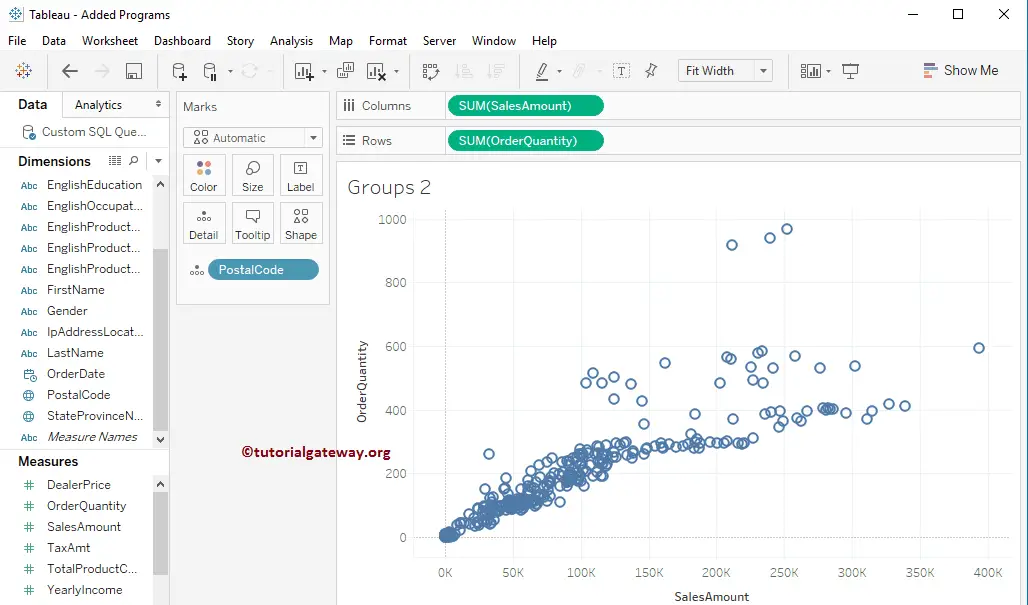
Create Tableau groups from Shapes
Our previous example showed you the steps involved in creating simple sets. This example shows how to generate tableau groups from shapes. For this, we use the Scatter Plot we created in our previous article. If you observe the plot, we have added the Sales Amount to the Columns Shelf, the Order Quantity to the Rows Shelf, and the Postal Code to the Details field in the Marks Shelf.
Please select the members you want to include in the set by holding the CTRL or SHIFT button and selecting the Icon in the tooltip below.
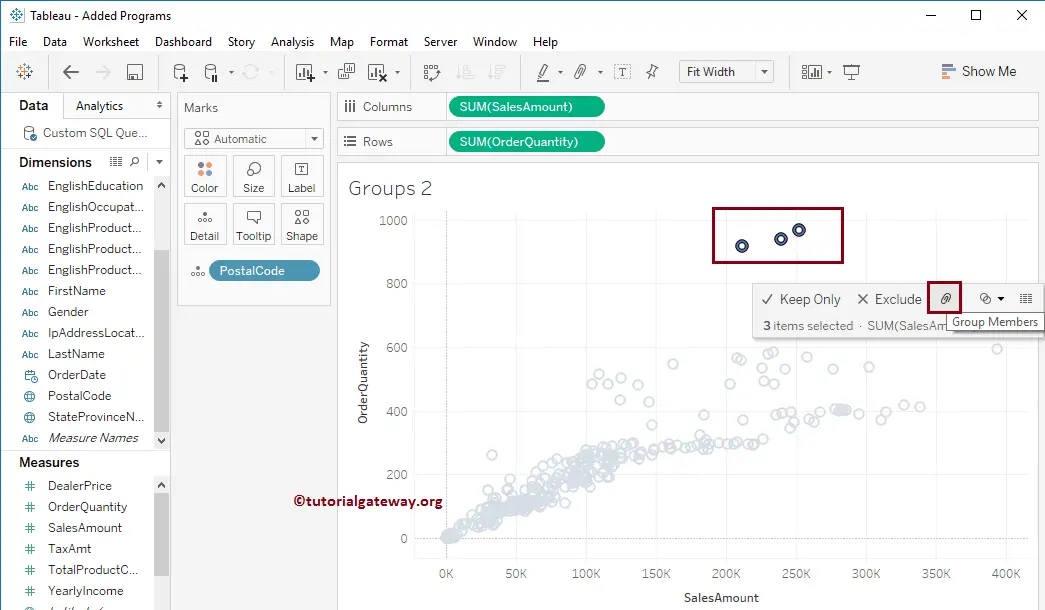
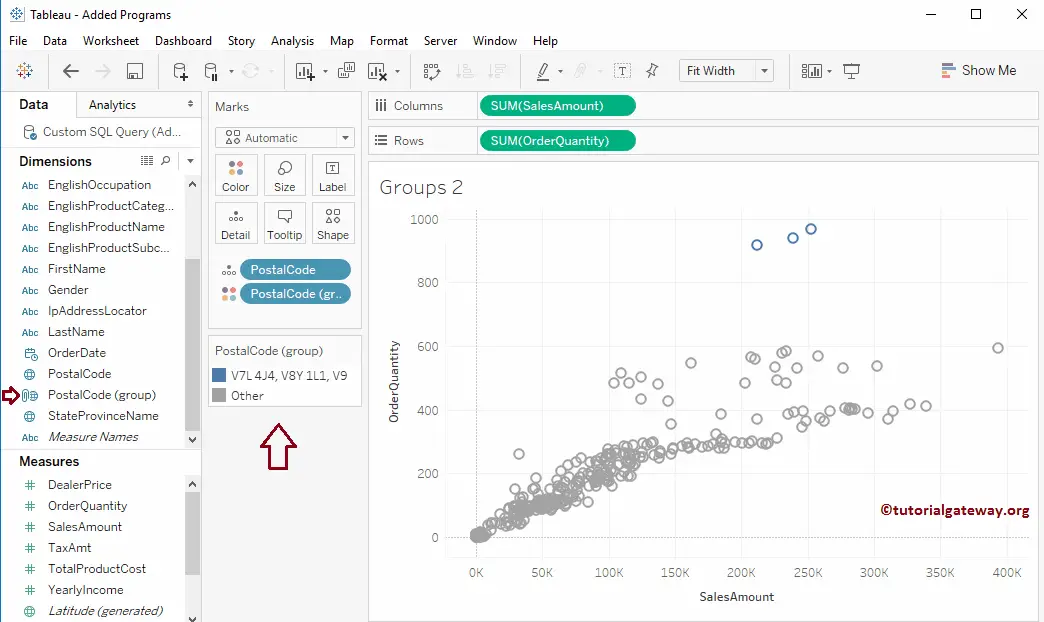
Now you can see our newly created one in the Dimensions pane.
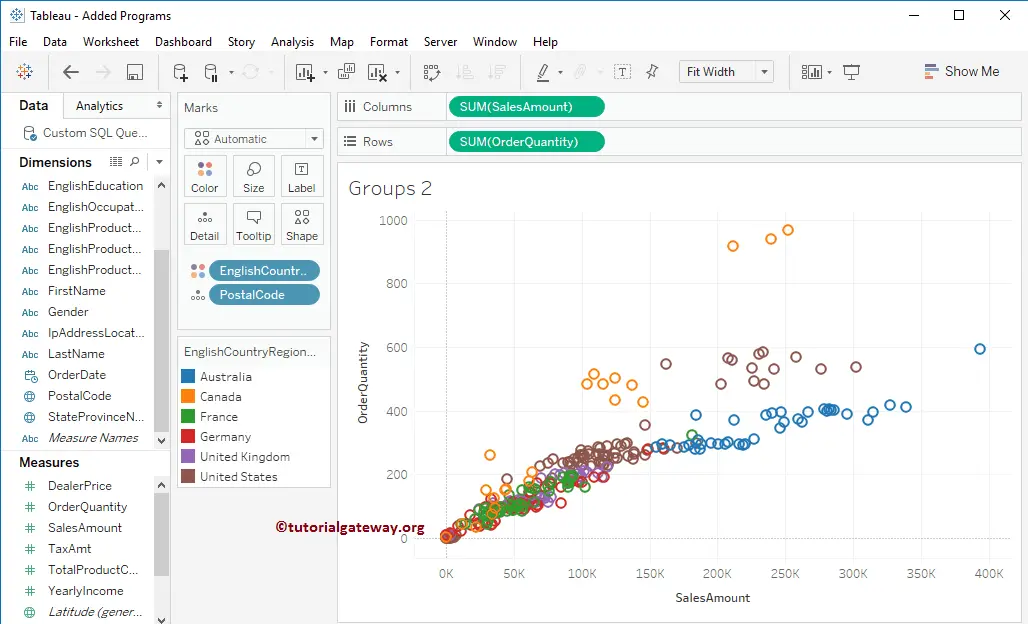
Create Tableau groups from Marks that represent Multiple Dimensions
Our previous example showed you the steps involved in creating categories using marks. There are some situations where each mark represents multiple dimensions. In this example, we explain how to create tableau groups from marks representing Multiple dimensions.
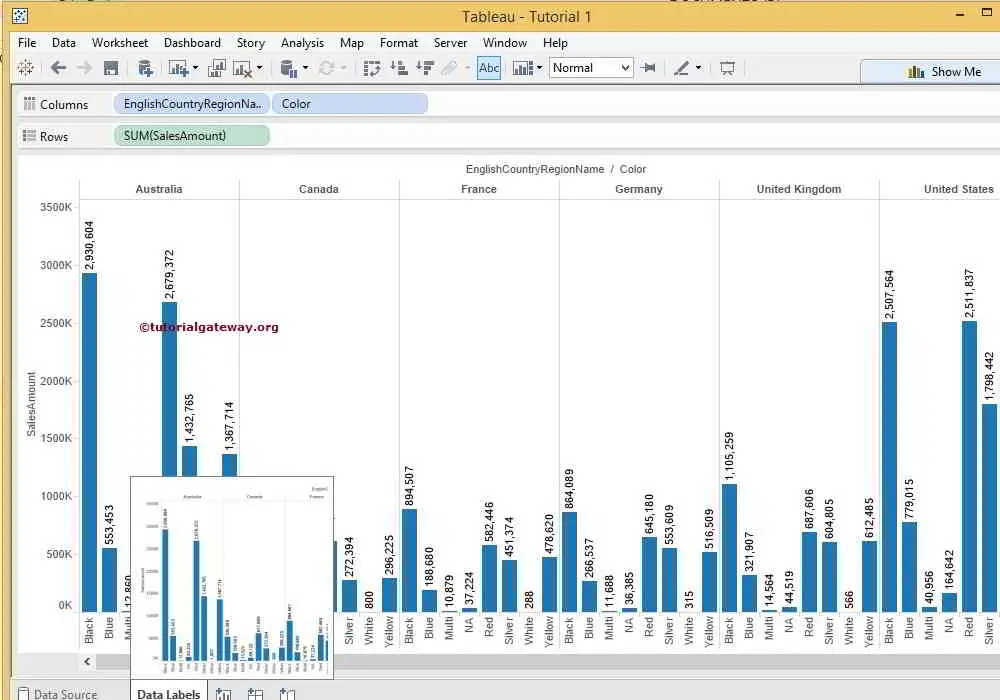
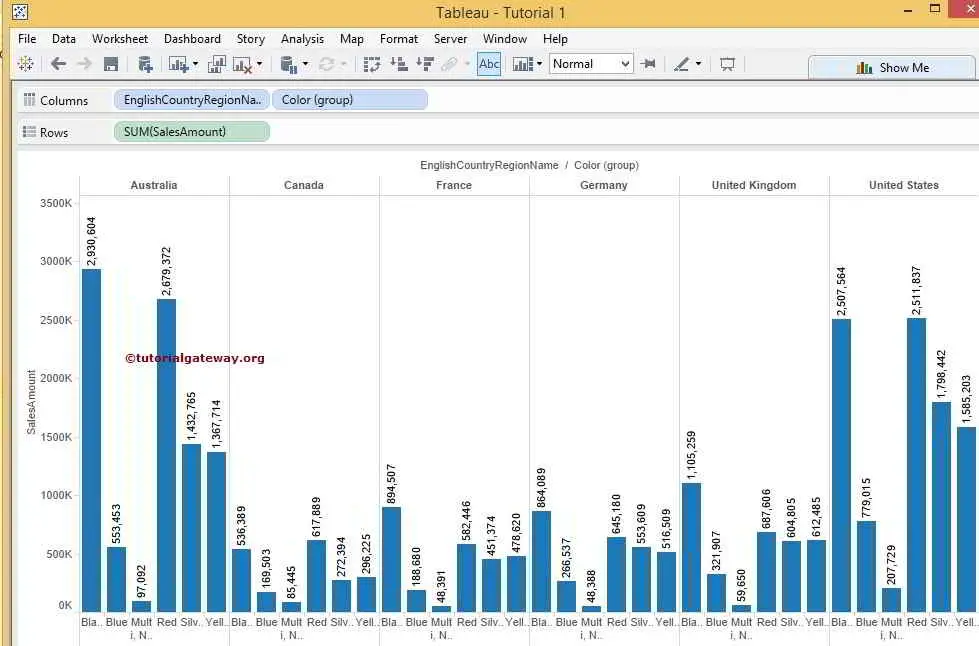
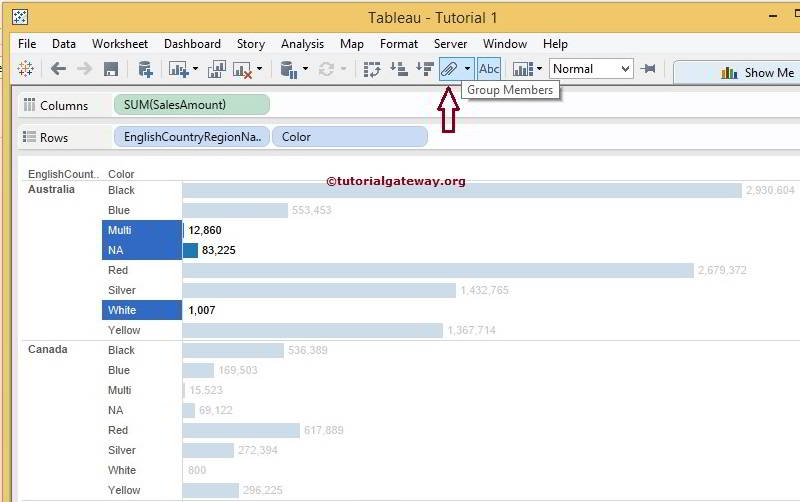
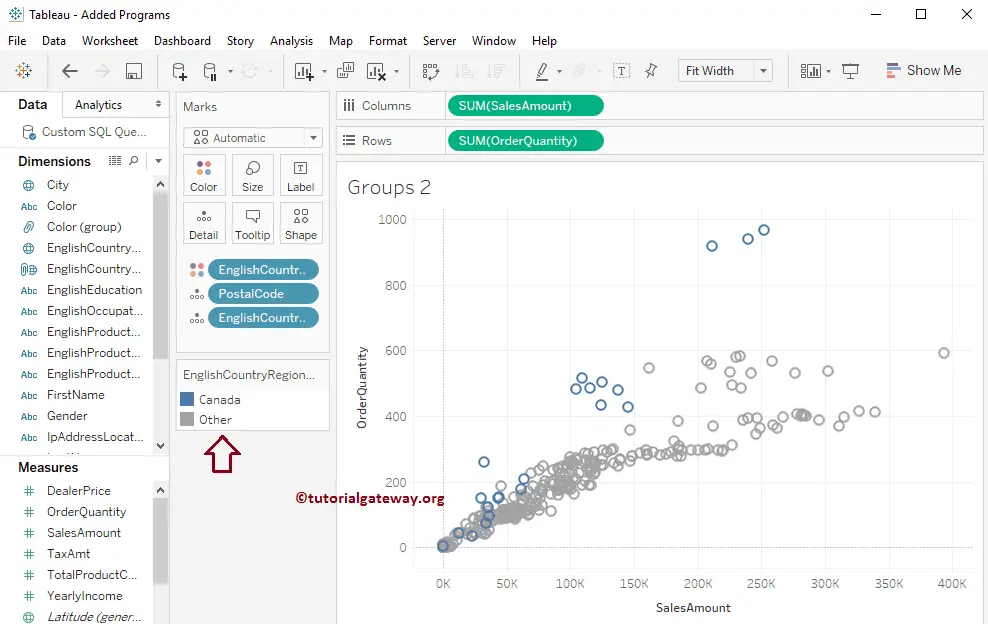
If you observe the plot, we have added the Sales Amount to the Columns Shelf, the Order Quantity to the Rows Shelf, the English Country Name to the Color field, and the Postal Code to the Details field in the Marks Shelf.
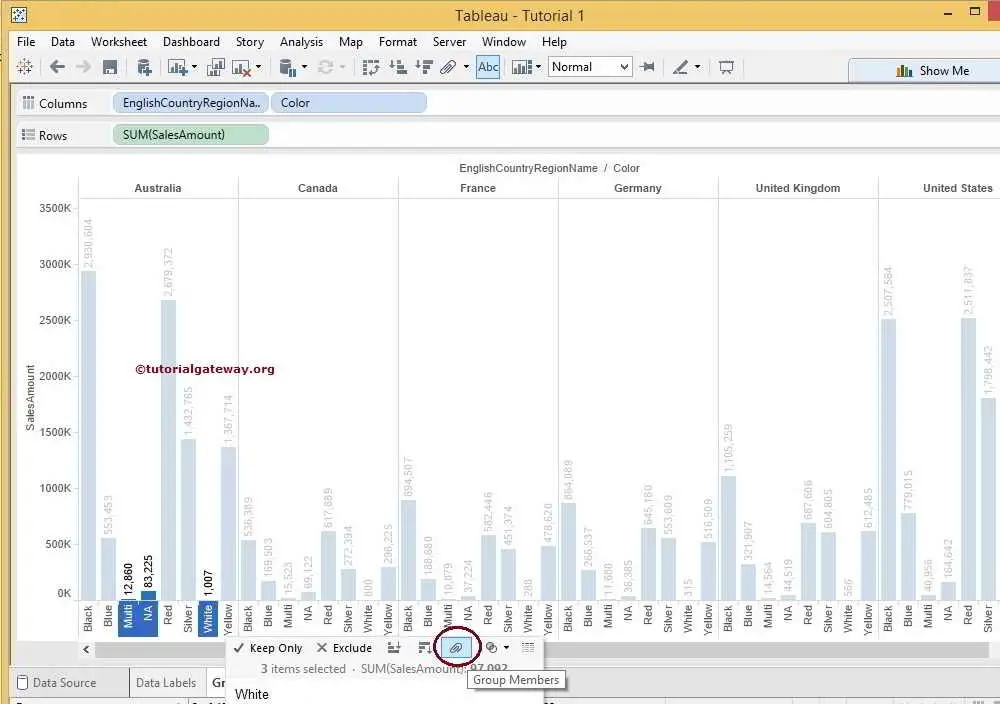
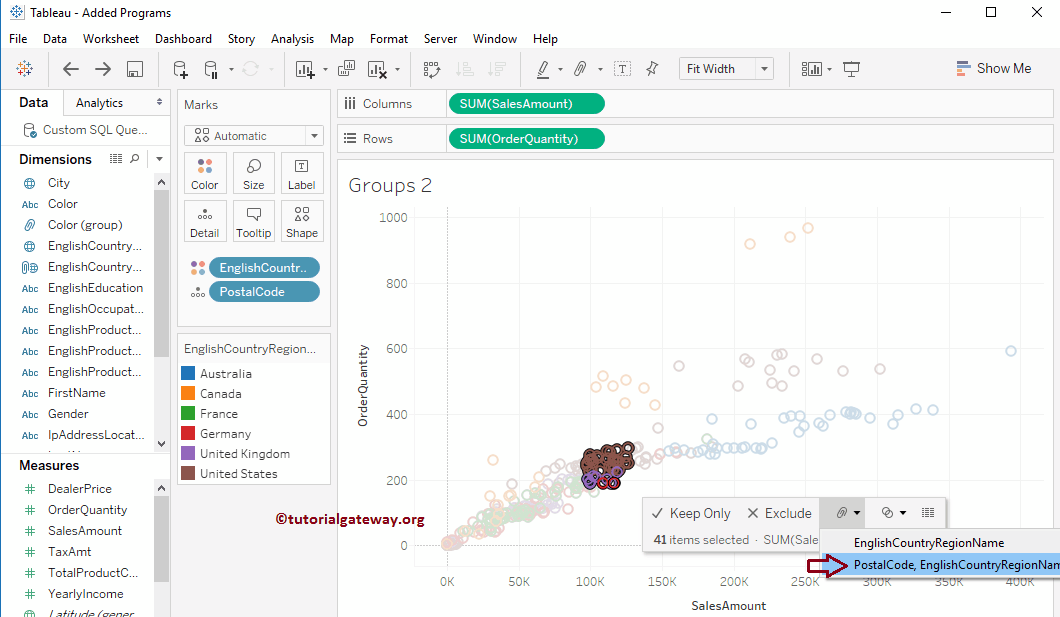
Please select the members you want to include in the set by holding the Control or SHIFT button. Each mark represents the English Country Name and the Postal Code (Multiple dimensions). That’s why the Grouping Icon present in the Tableau tooltip provides you with an option to select the option. For now, we are selecting the English Country Region Name.
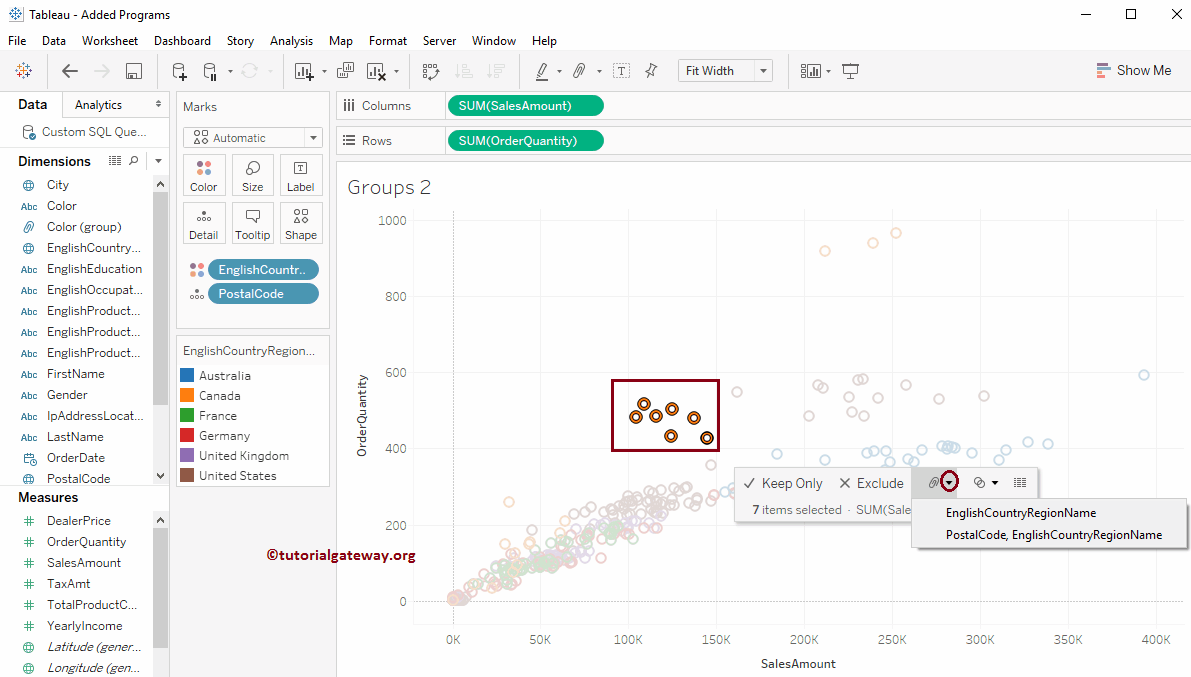
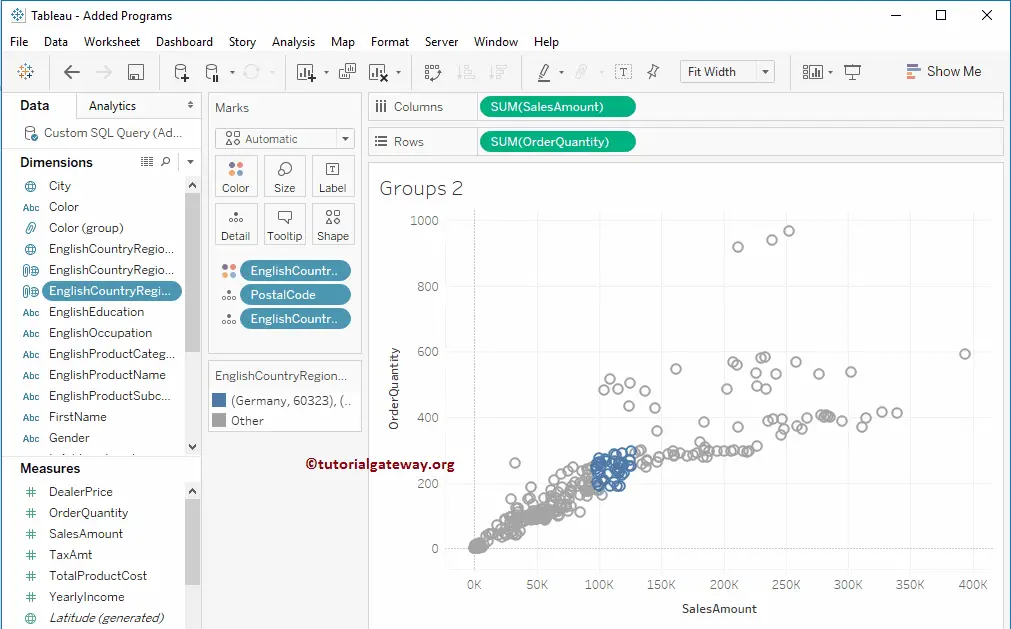
Now, you can see the English Country Region Name Group.
Let me change the option to a later one.
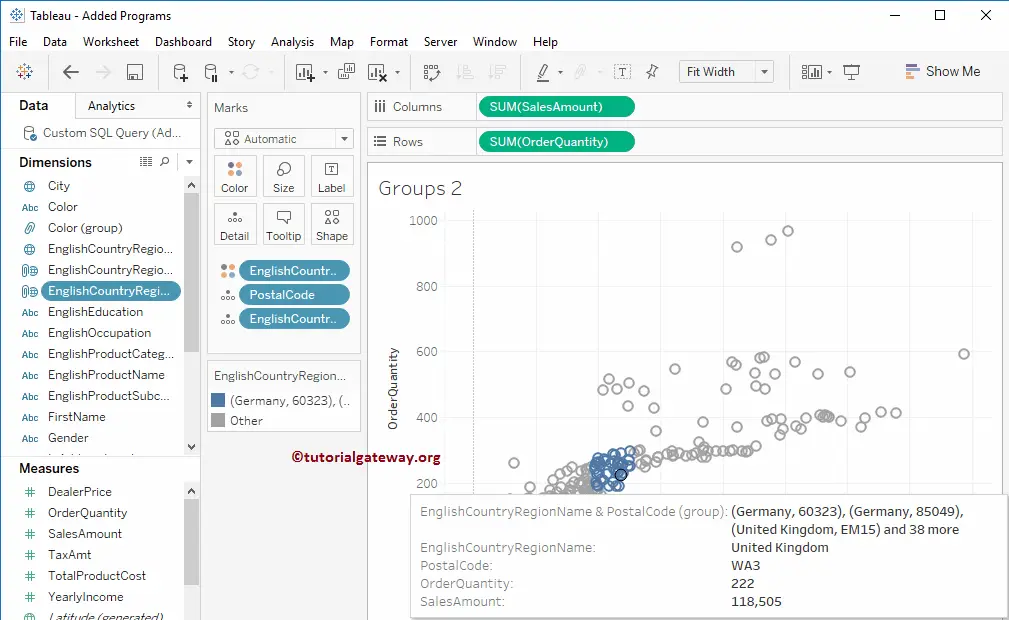
The below screenshot will show you the Scatter plot Grouped by the Postal Code and the Country name.
Hovering over any group item will open a tooltip with detailed information.
Create Tableau Group from Dimensions Pane
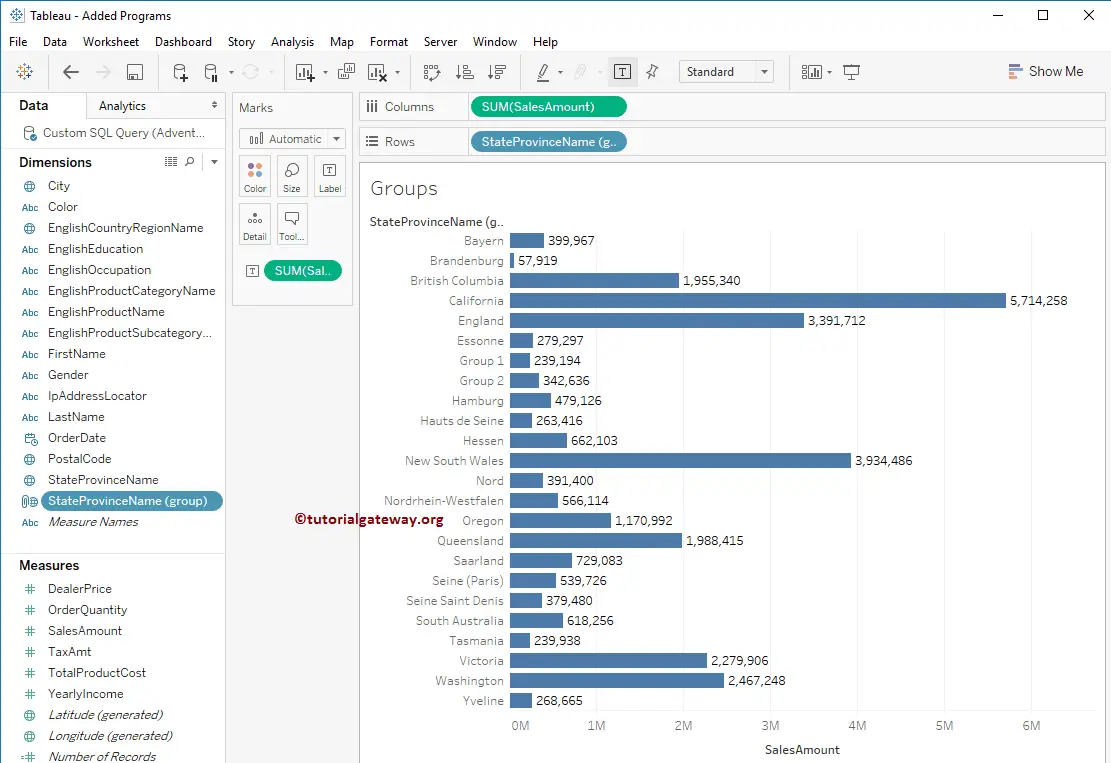
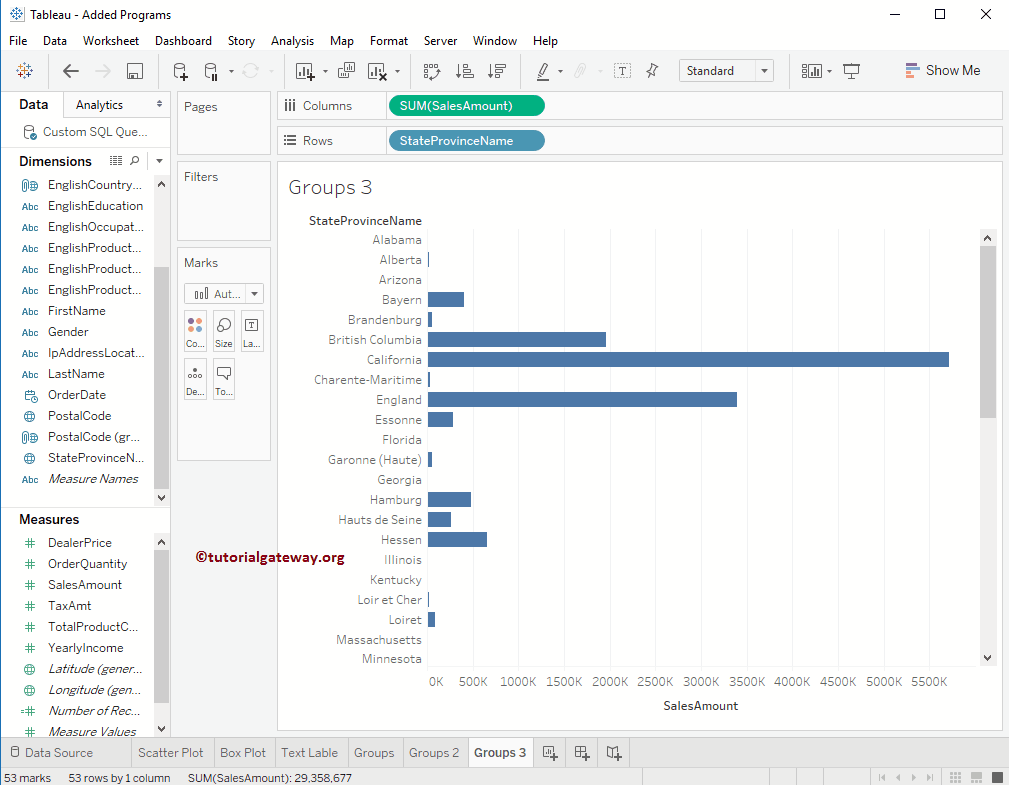
In this Groupby example, we will show you how to create a Group from the Tableau dimensions pane. To do this, Drag and Drop the State-Province name from Dimension Region to Rows Shelf and the Sales Amount from Measures region to Columns Shelf.
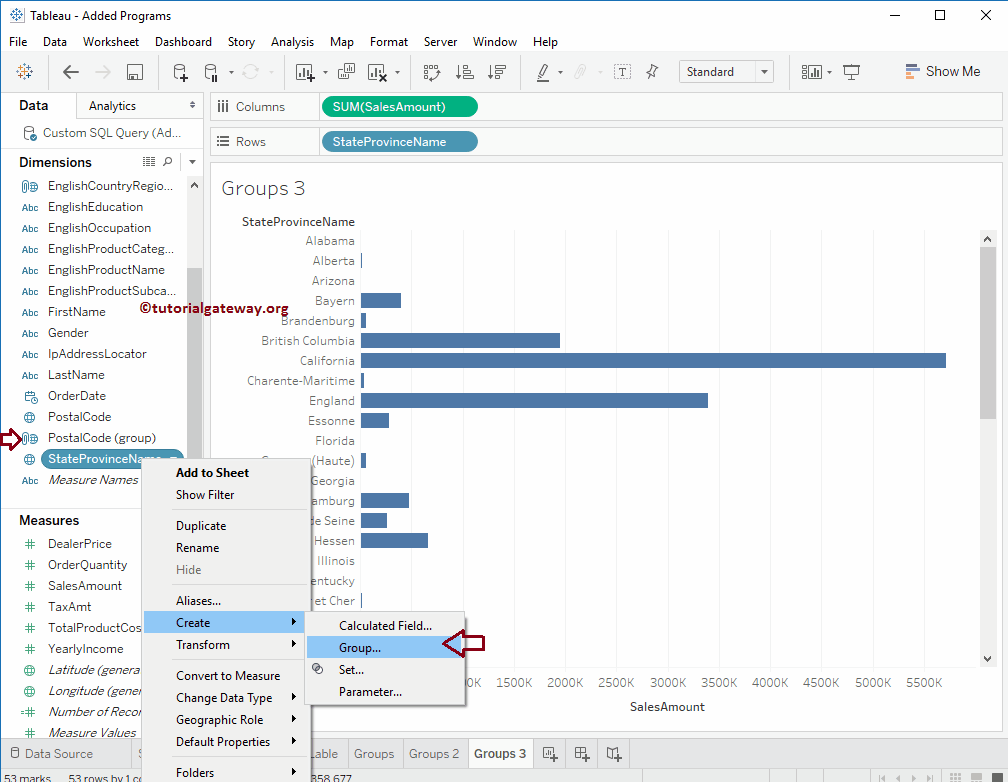
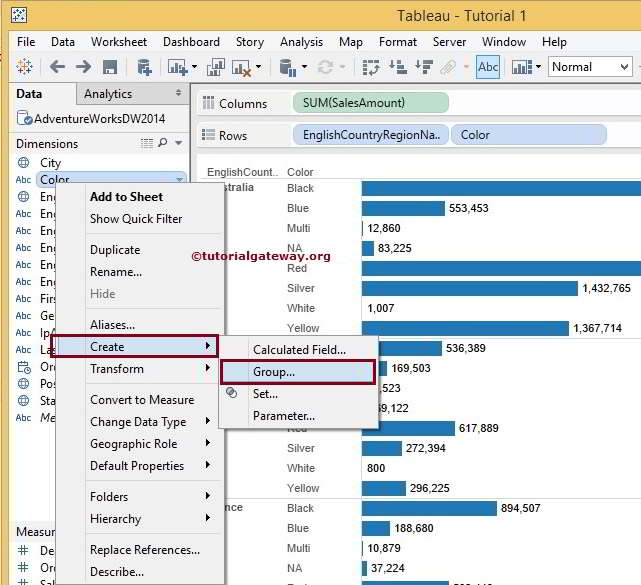
To create a Tableau groupby from the dimensions pane, Please select the Dimension on which you want to create the group, and then right-click on it will open the context menu. Please select the Create option and then choose the Group.. option from the context menu.
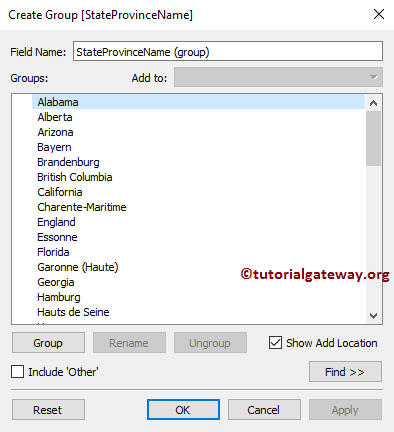
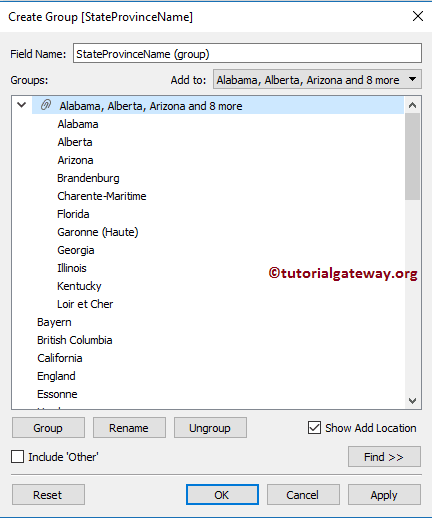
Once you select the option, a new window will open
- Field Name: Please specify the Unique name for the category or leave the default name. Make sure that the name should reflect the set functionality.
- Add to: This will show the existing ones. You can use this to add the items to the existing set.
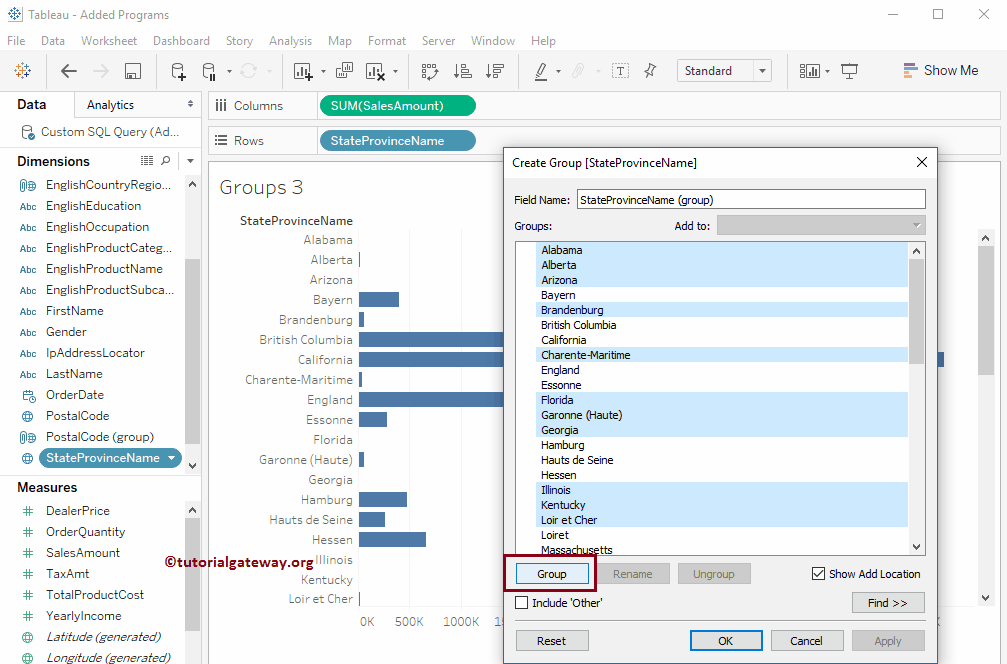
We are selecting some of the random low-performed states. Please do not forget to click the Group button.
Once you click on the button, a new group with a random name will be created. You can use the Rename button to change the name as per your specifications.
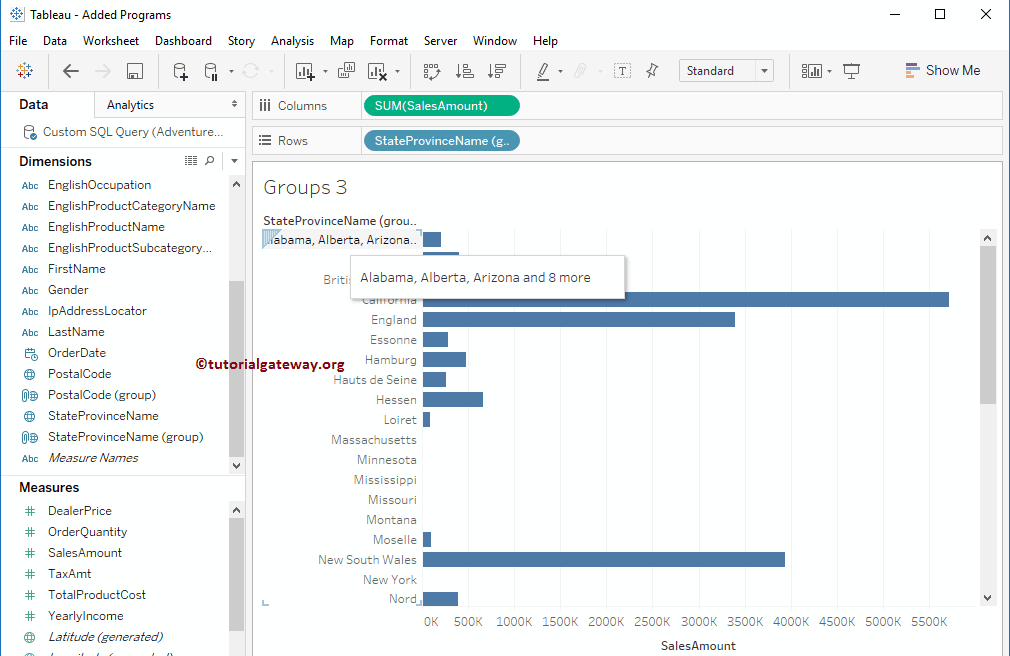
Next, click Apply and the OK button to close the window. That’s it; we successfully created our Tableau Group from the dimension pane groupby members. Let us replace the State Province Name from the Row shelf with the State Province Name group.
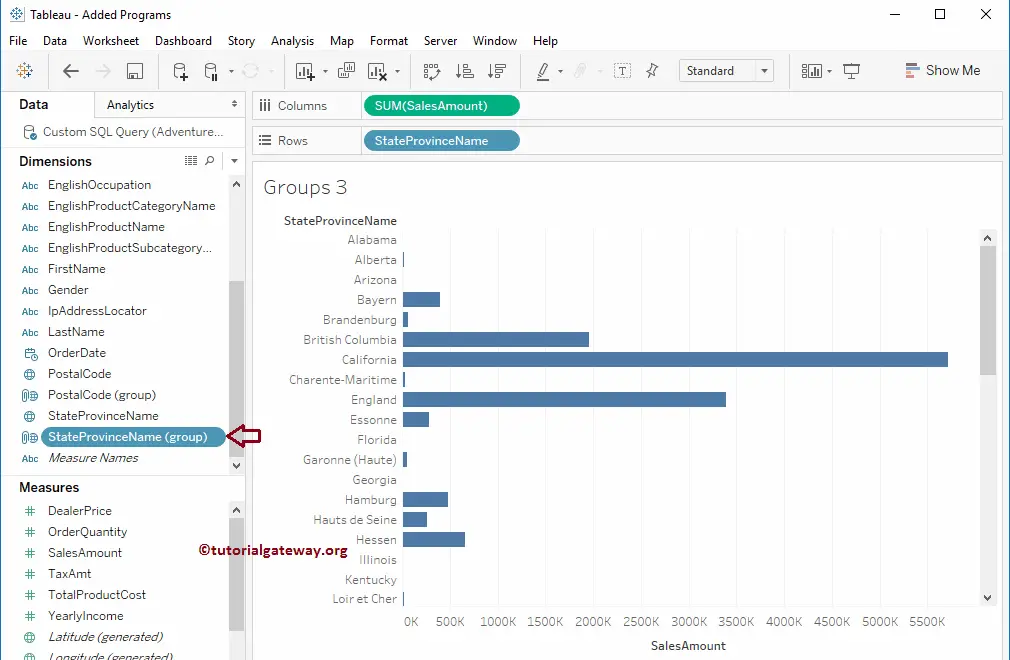
It will show you the newly created and added Group in the report.
Grouping from Dimenion Pane on Side-by-side bar chart
Select and Right Click on the Tableau Dimension on which you want to perform grouping. Please select Create and then Group.. option.
Once you select the option, the Create Group window will open with available records in that dimension. You can notice that we have only 8 distinct records. Please select the records you want to unite. In this example, we will group Multi, NA, and White color products. So, pick them and click on the Group button.
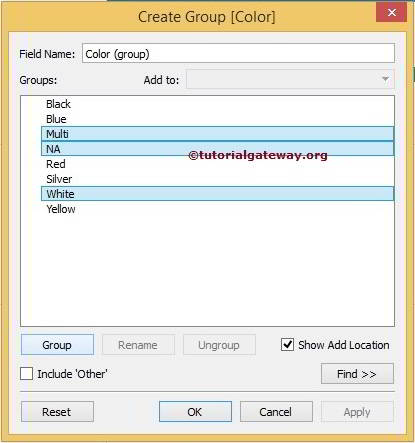
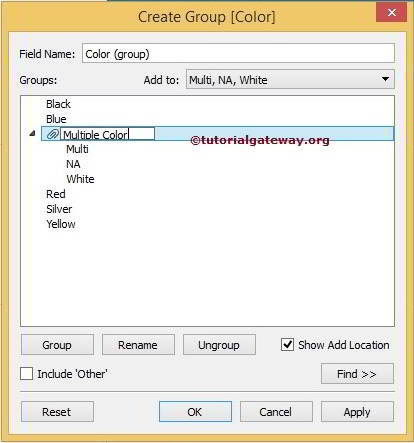
Next, Edit the name. Here, we changed it to multi-color and clicked the OK button.
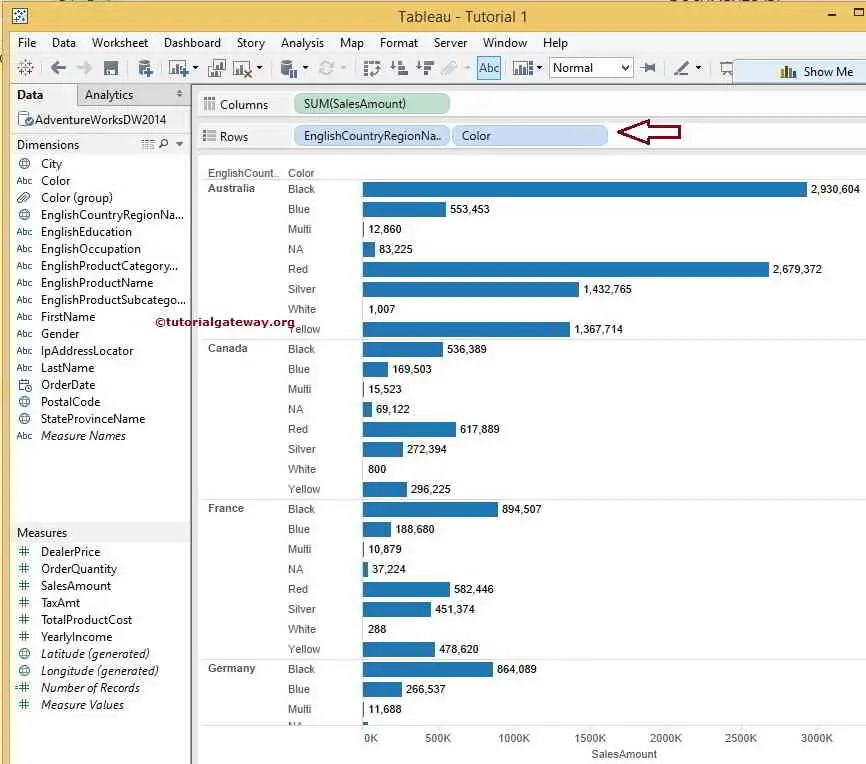
Although we performed tableau Grouping on Multi, NA, and White products, the groupby screenshot below shows individual products rather than united ones because we haven’t changed the Color from the Rows Card.
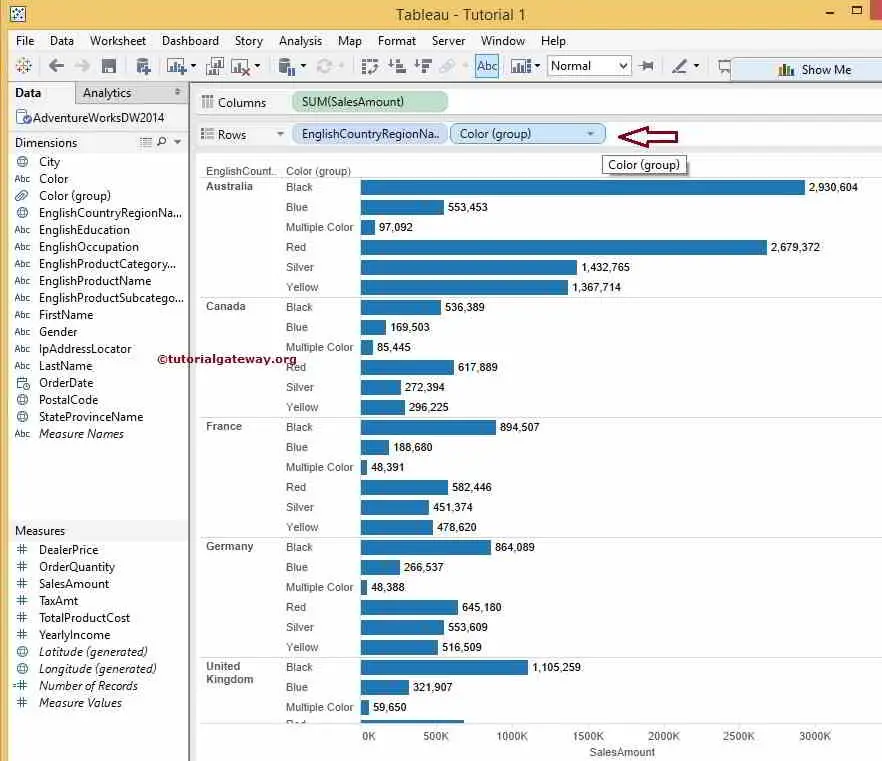
The desktop will update the report below once you change the Color dimension with Color Group.
Delete Tableau Grouping
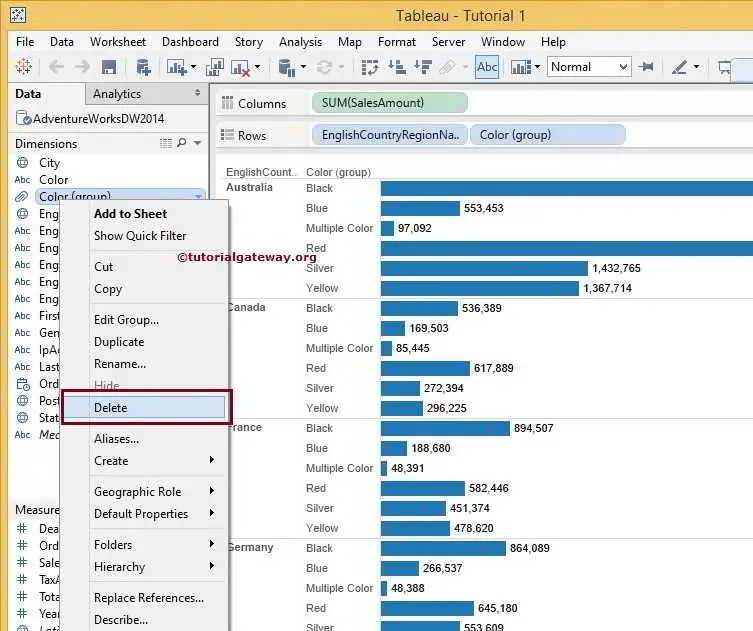
To delete grouping, select and Right Click on the name you want to delete, which will open the context menu. Please select the Delete option.
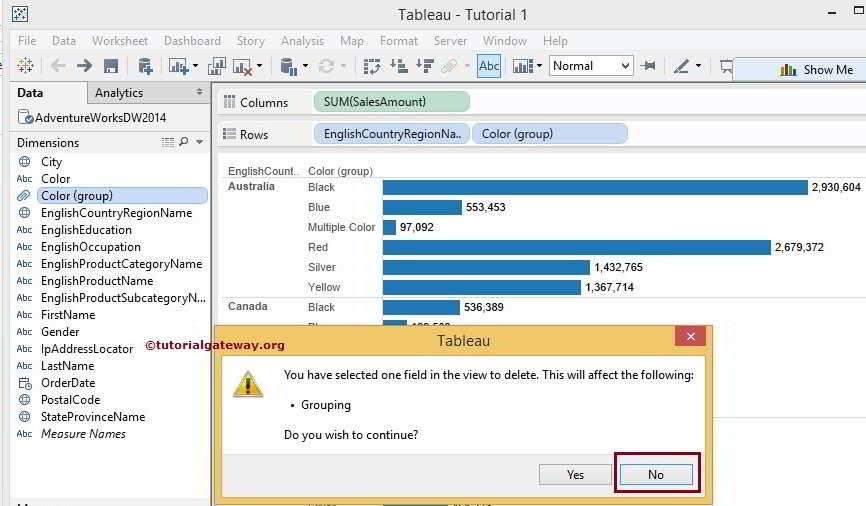
Since we use Color Grouping in the report, it displays the following error. We clicked the No button because we didn’t want to delete it.
How to Edit Tableau Group?
In this section, we will show you how to alter or edit Tableau Group with an example. For this, we will use the Tableau sheet we created in our previous article.
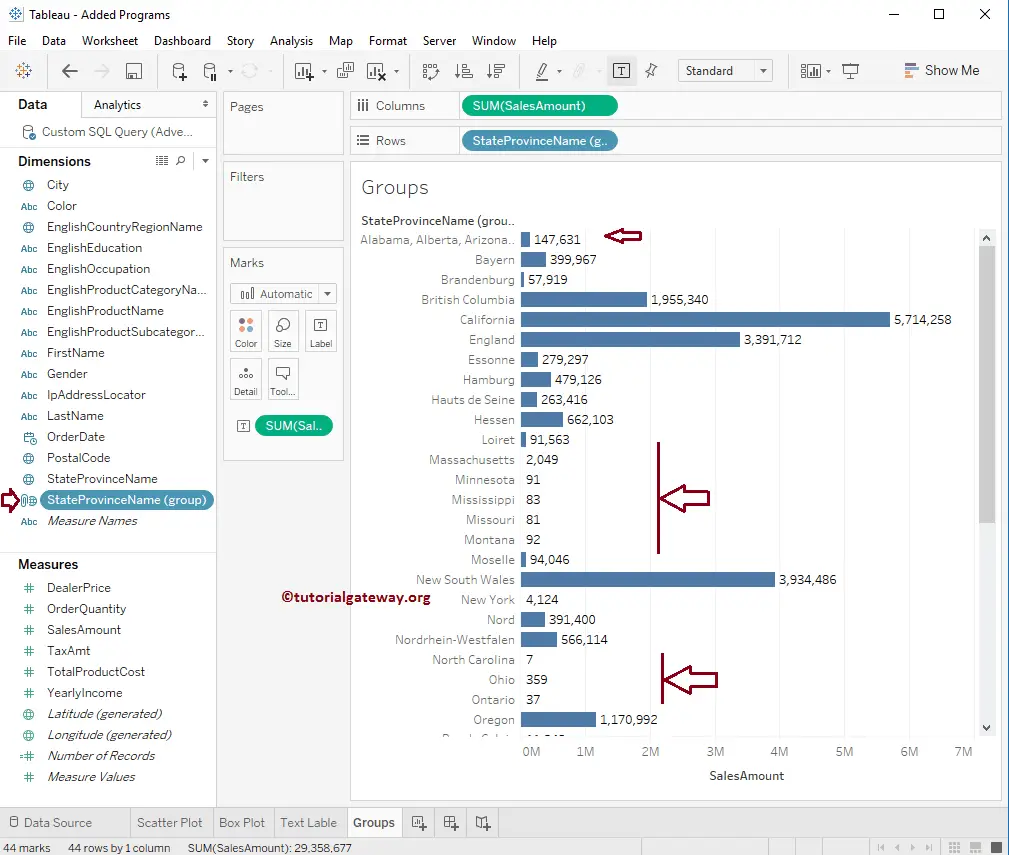
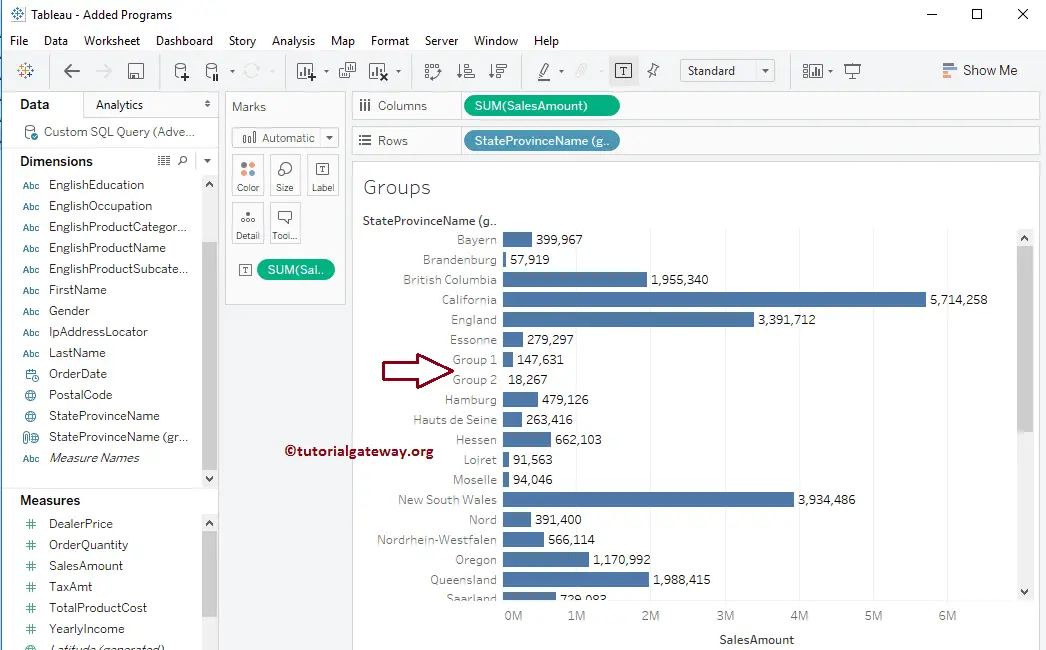
From the screenshot below, you can observe that we have a few more states running with the least sales. So, our task is to edit and add those states to the existing groupby or create a new Tableau group.
Edit Tableau Group
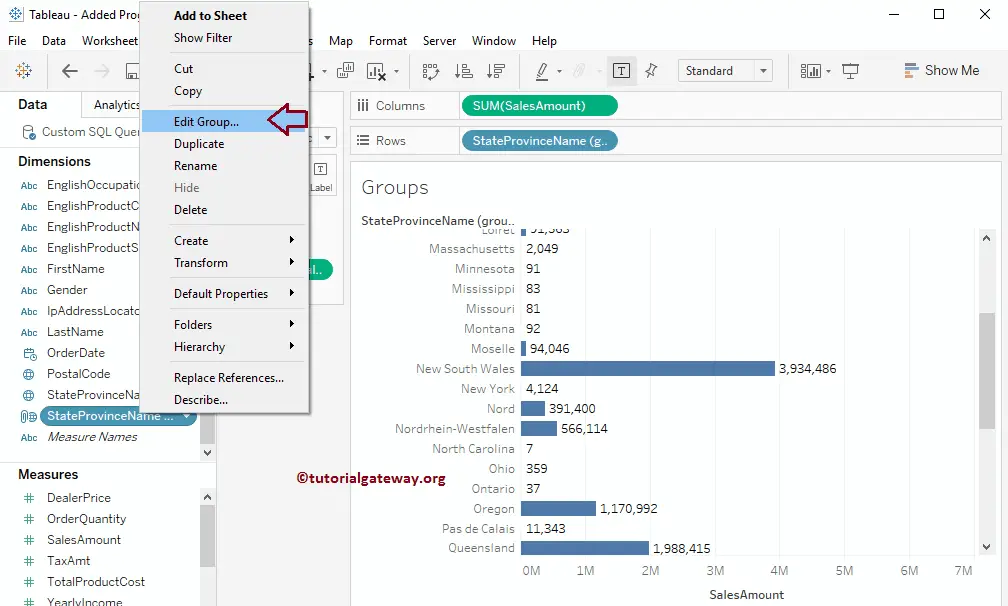
To edit the existing groups, Please select the Tableau Group you want to alter and then Right-click on it to open the context menu. Please select the Edit Group.. option from it.
Once you select the Group.. option, a new window called Edit Group will open
Add New Tableau Group
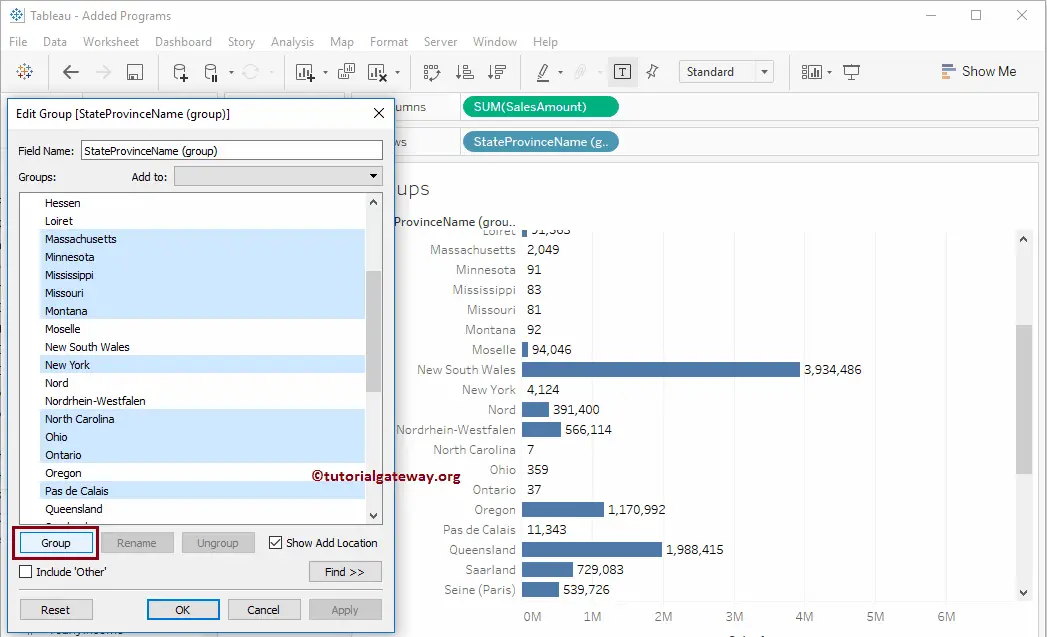
Here, we will create a new group. From the below screenshot, you can observe that we are selecting the low-performed states and clicking the Group button.
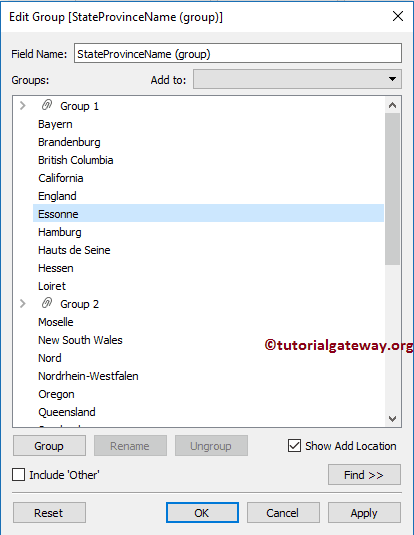
Now you can see the new Group and the old one we created in our earlier section.
Next, we used the Rename button to change the group names to Group 1 and Group 2. I suggest you change the names per your requirement (meaningful names).
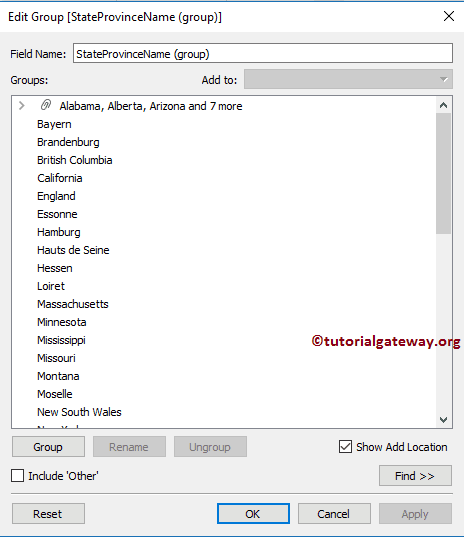
Next, click Apply and the OK button to close the window. From the below screenshot, you can see our newly created group.
Add members to the Tableau Group
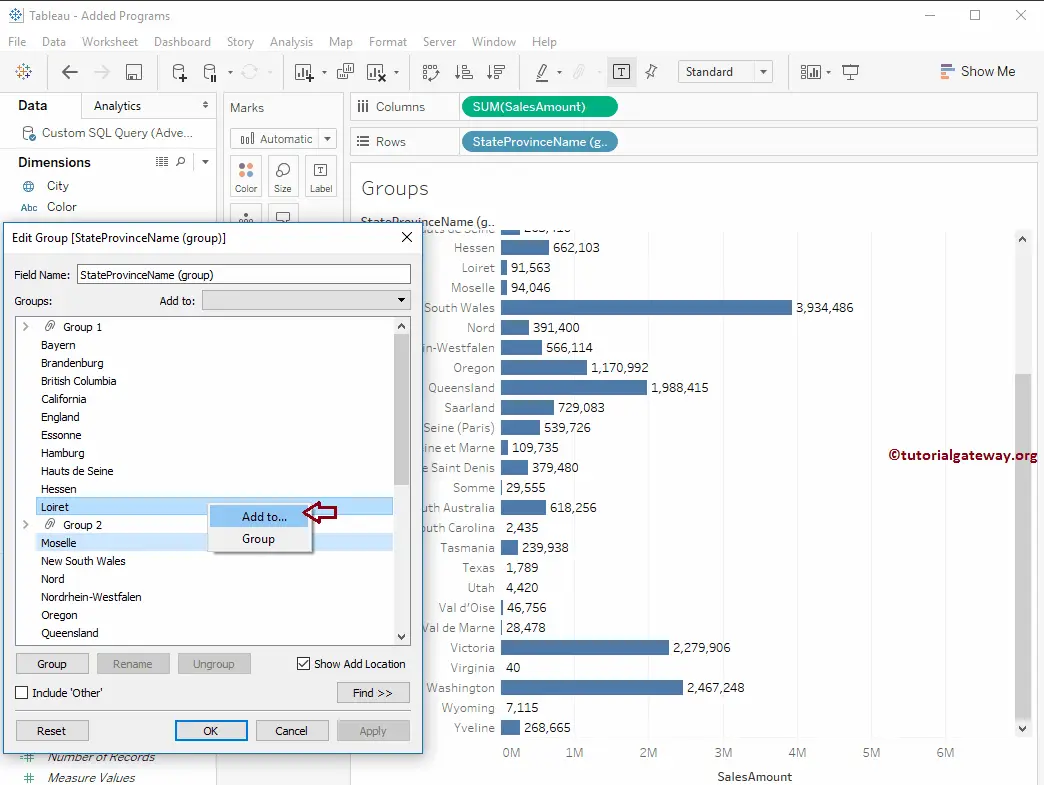
Please select the member(s) you want to add, and right-click on it will open the context menu with two options. Please select the Add To .. option to add the member to the existing group or select the Group option to create a new group. From the below screenshot, you can observe that we are selecting the Loiret state.
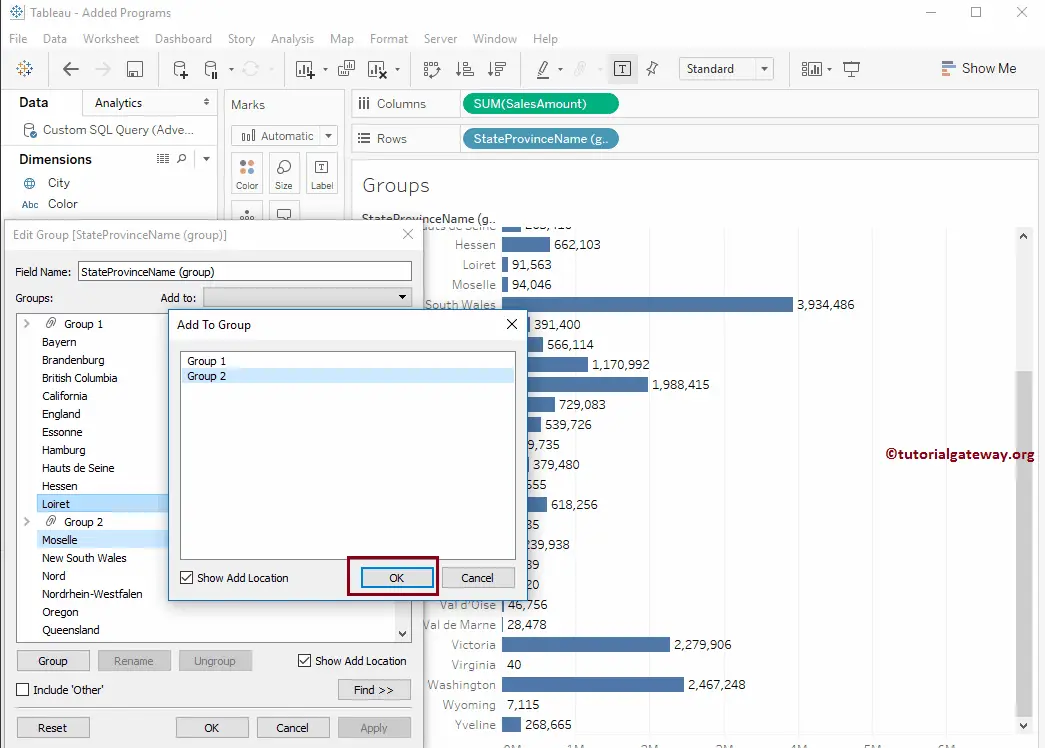
Once you select the Add To .. option, an Add to Group window with existing group names will open. Please select the group name you want to add to.
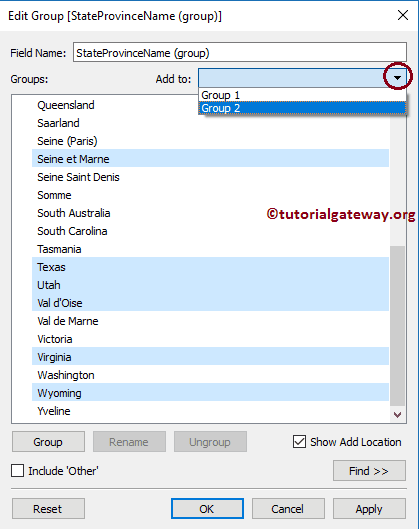
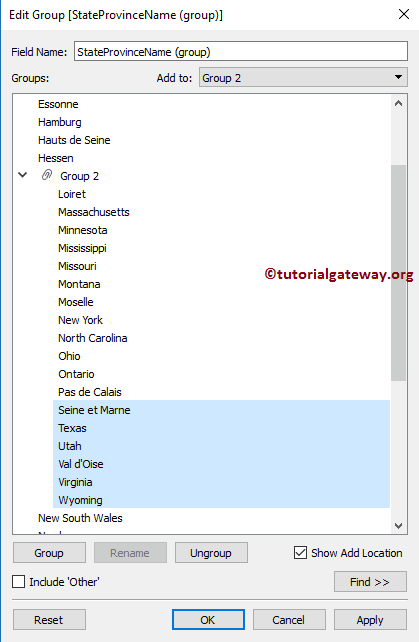
Second Approach to add members to the Tableau Group
Please select the member(s) you want to add and select the Group name from the Add To drop-down list, as shown below.
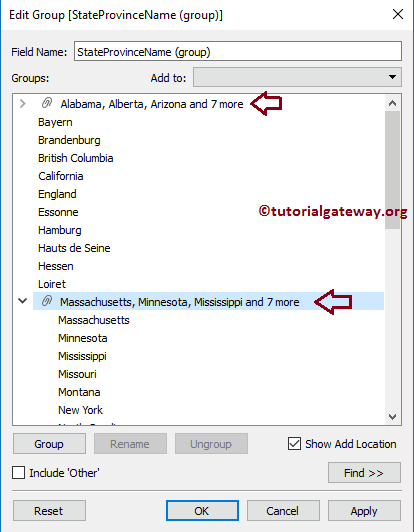
The below screenshot will show our newly added states.
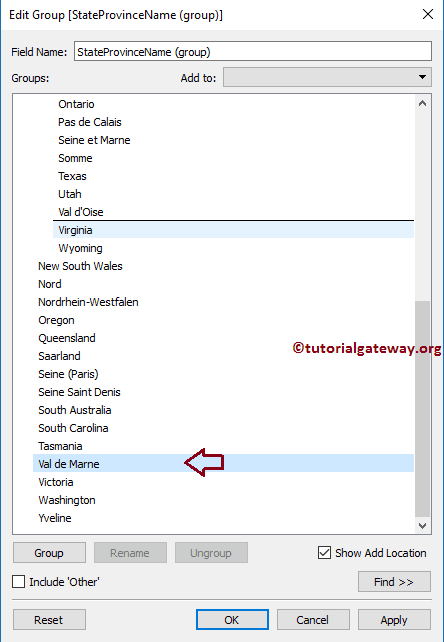
Add members to the Tableau Group by drag and drop
Drag and drop the member(s) to the group that you want to add
Add Member of One Group to Another Group
Please select the member(s) you want to add and then drag that member to another group.
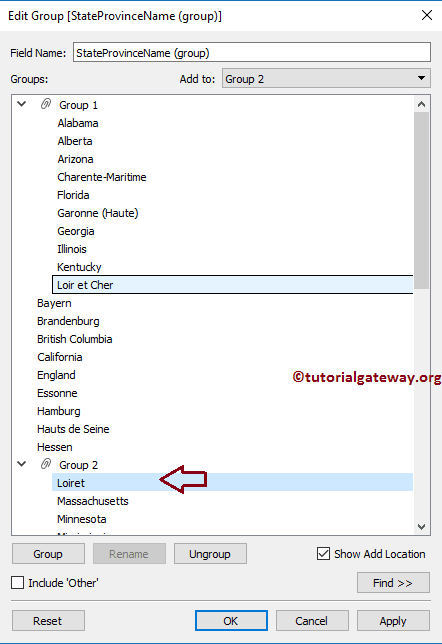
The following screenshot will show you the groups that we edited.