The R ggplot2 dot Plot or dot chart consists of a data point drawn on a specified scale. Let me show how to Create an R ggplot dotplot, Format its colors, and plot horizontal dot plots with an example. For this R ggplot2 Dot Plot demonstration, we use the airquality data set provided by the studio.
Syntax
The syntax to draw a dot plot in R Programming is
geom_dotplot(binaxis = "x", mapping = NULL, data = NULL,
  position = "identity", ..., method = "dotdensity",binwidth = NULL,
  stackratio = 1, binpositions = "bygroup", stackdir = "up", right = TRUE,
  stackgroups = FALSE, dotsize = 1, show.legend = NA, origin = NULL,
  width = 0.9, na.rm = FALSE, inherit.aes = TRUE, drop = FALSE)
Create a basic R ggplot2 Dot Plot
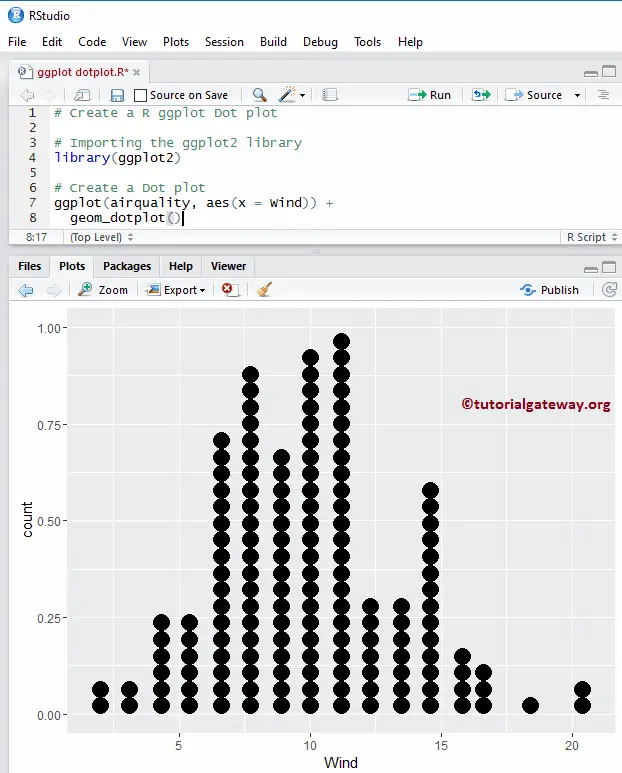
In this example, we show you how to create a basic dotplot using the ggplot2 package. For this, we are going to use the airquality data set provided by the R Studio.
TIP: ggplot2 package not installed by default. Please refer Install R Packages article to install a package in R Programming.
# Create a ggplot Dot plot

# Importing the ggplot2 library
library(ggplot2)

# Create a Violin plot
ggplot(airquality, aes(x = Wind)) +
  geom_dotplot()
Change the R ggplot2 Dot Plot binwidth
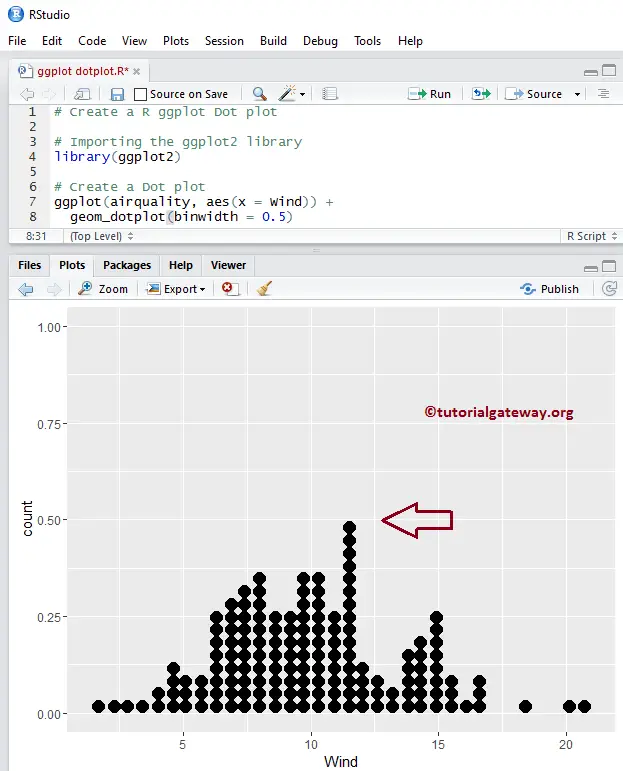
In this R ggplot dotplot example, we show how to change the bin width of a dot plot using the binwidth argument.
binwidth:
- When the method = “dotdensity” (default), binwidth specifies maximum bin width.
- When the method = “histodot”, binwidth specifies bin width.
NOTE: If you require to import data from external files, then please refer R Read CSV article to import the CSV file.
# Change the binwidth of an R ggplot Dot plot

# Importing the ggplot2 library
library(ggplot2)

# Create a Dot plot
ggplot(airquality, aes(x = Wind)) +
  geom_dotplot(binwidth = 0.5)
Change R ggplot2 Dot Plot method
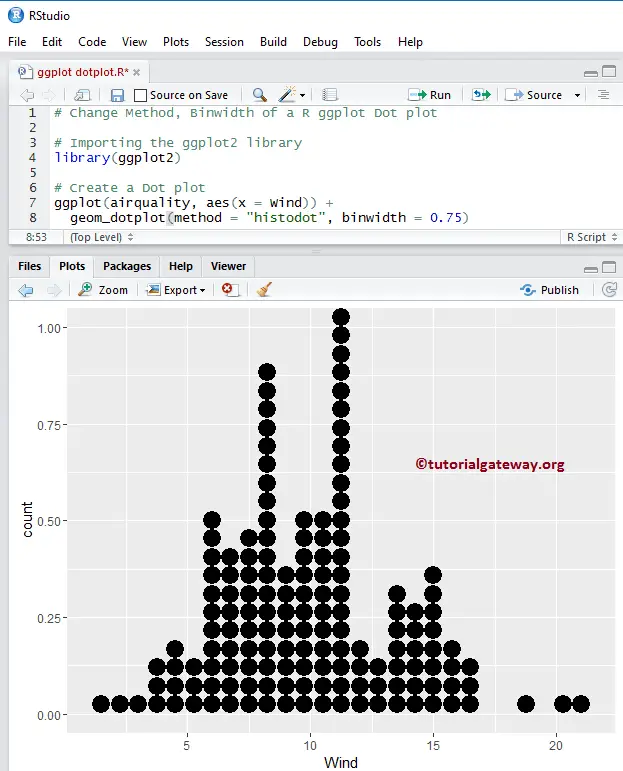
In this R ggplot dotplot example, we show how to change the method of a dot plot using the method argument.
- method: By default, its value is dotdensity, but you can change to histodot for fixed bin widths.
# Change Method, Binwidth of the ggplot Dot plot

# Importing the ggplot2 library
library(ggplot2)

# Create a Dot plot
ggplot(airquality, aes(x = Wind)) +
  geom_dotplot(method = "histodot", binwidth = 0.75)
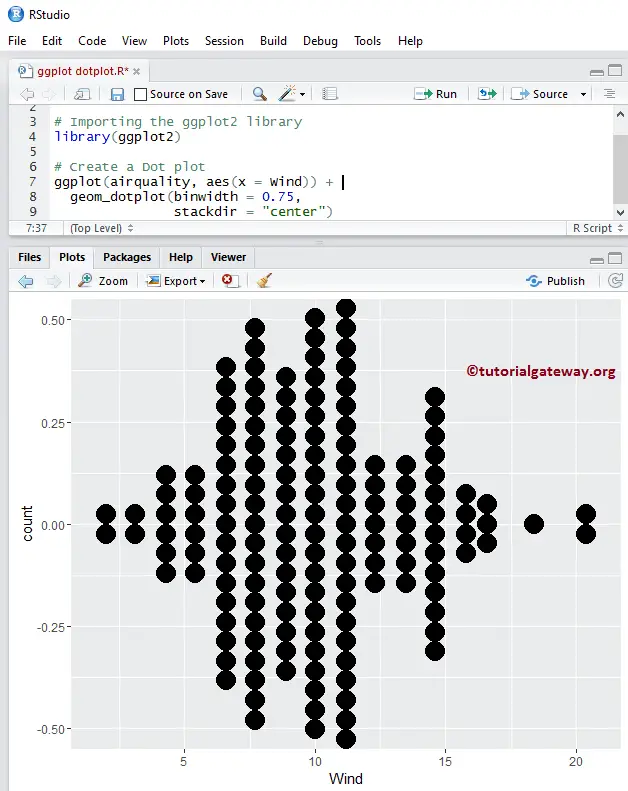
Change R ggplot2 Dot Plot stack Direction
In this R ggplot dotplot example, we change the dot stack direction in a dot plot using the stackdir argument.
- stackdir: By default, its value is up (it means dots stacked in the upward direction), but you can change to down, center, and centerwhole.
# Change Stack Direction

# Importing the ggplot2 library
library(ggplot2)

# Create a Dot plot
ggplot(airquality, aes(x = Wind)) +
  geom_dotplot(binwidth = 0.75,
               stackdir = "center")
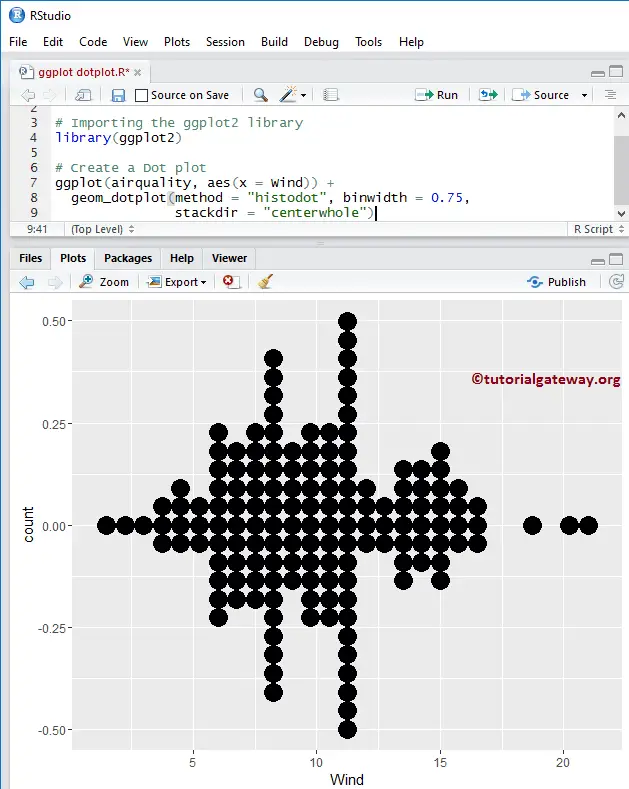
Change R ggplot2 Dot Plot stack Direction 2
Here, we are changing the stack direction value from center to centerwhole
# Change Stack Direction of an ggplot Dot plot

# Importing the ggplot2 library
library(ggplot2)

# Create a Dot plot
ggplot(airquality, aes(x = Wind)) +
  geom_dotplot(method = "histodot", binwidth = 0.75,
               stackdir = "centerwhole")
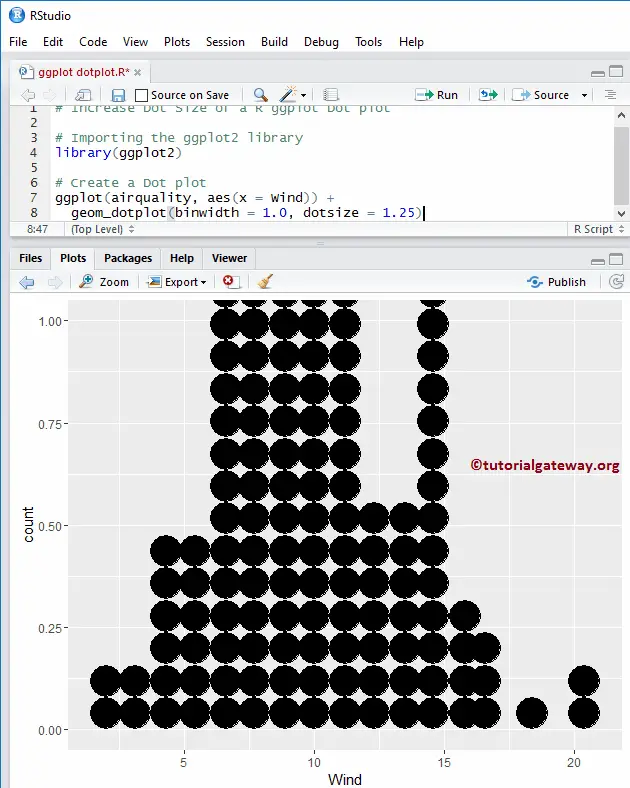
Alter R ggplot2 Dot Plot Dot size
In this example, we change the dot size in an R ggplot dotplot using the dotsize argument.
# Increase Dot Size of a ggplot Dot plot

# Importing the ggplot2 library
library(ggplot2)

# Create a Dot plot
ggplot(airquality, aes(x = Wind)) +
  geom_dotplot(binwidth = 1.0, dotsize = 1.25)
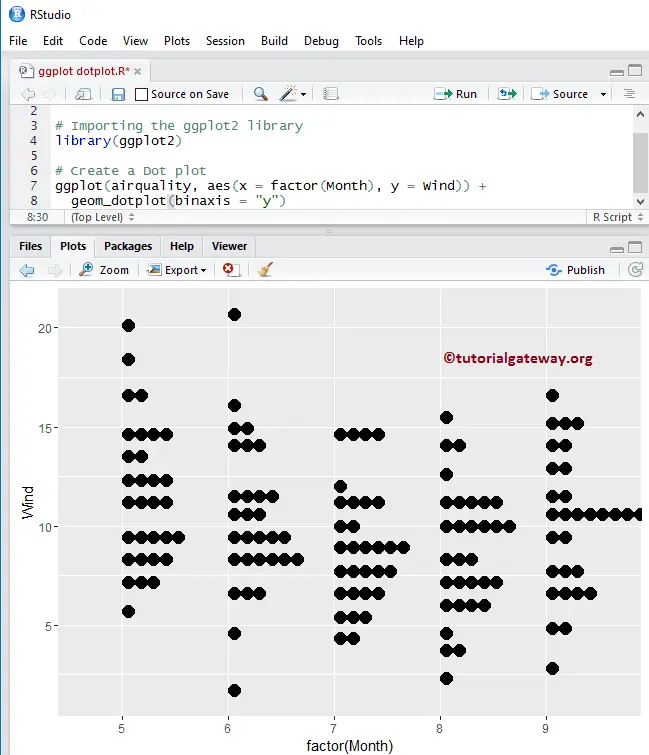
R ggplot2 Dot Plot Stacking on the y-axis
In this example, we change the stack axis to the y-axis
# ggplot Dot plot - Stacking on the Y-Axis

# Importing the ggplot2 library
library(ggplot2)

# Create a Dot plot
ggplot(airquality, aes(x = factor(Month), y = Wind)) +
  geom_dotplot(binaxis = "y")
R ggplot2 Dot Plot Stacking on y-axis 2
In this example, we are changing the stack direction
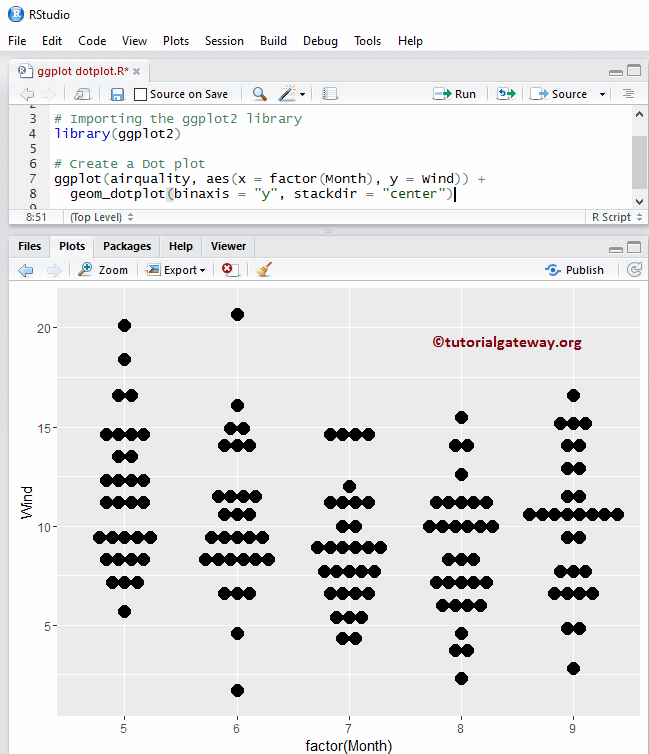
# ggplot Dot plot - Stacking on Y-Axis

# Importing the ggplot2 library
library(ggplot2)

# Create a Dot plot
ggplot(airquality, aes(x = factor(Month), y = Wind)) +
  geom_dotplot(binaxis = "y", stackdir = "center")
Change Colors of a Dot Plot in R
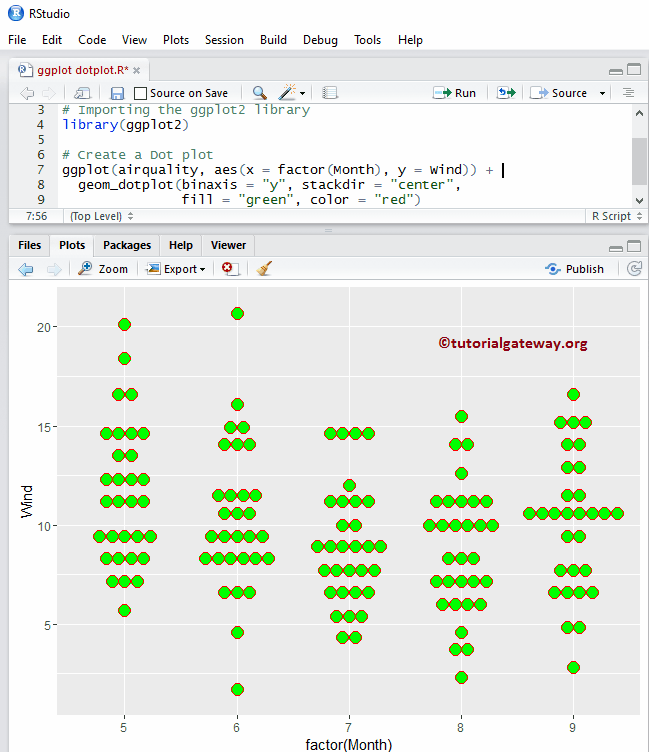
Let us change the dot plot colors using fill argument
- fill: Please specify the color you want to use for your dot plot. Type colors() in your console to get the list of colors available in R programming
- color: Assign the color for the borders of a dot
# Change Colors of an ggplot Dot plot

# Importing the ggplot2 library
library(ggplot2)

# Create a Dot plot
ggplot(airquality, aes(x = factor(Month), y = Wind)) +
  geom_dotplot(binaxis = "y", stackdir = "center",
               fill = "green", color = "red")
Change Colors of an R Dot Plot using Columns
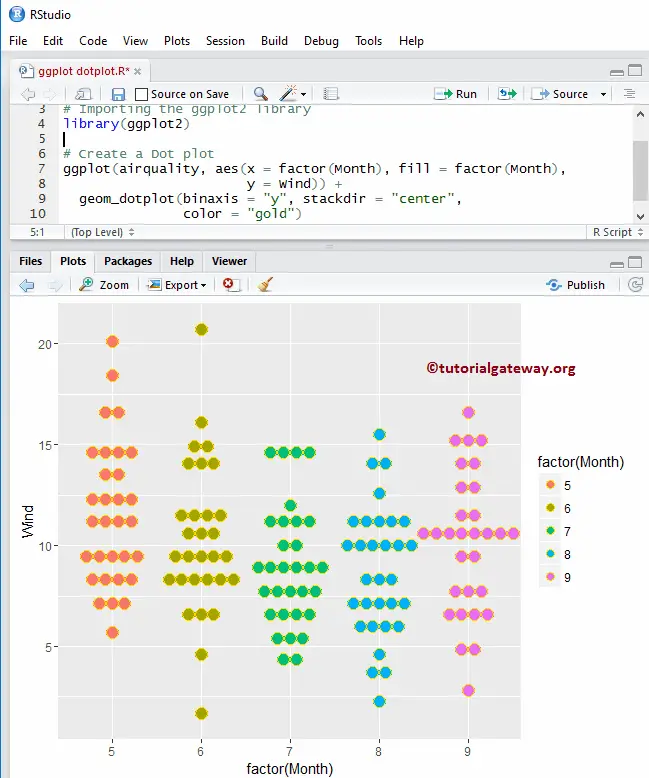
Let us see how to change the dot plot colors using column data. Here, we are using the Month column data to differentiate the colors
# Change Colors of an ggplot Dot plot

# Importing the ggplot2 library
library(ggplot2)

# Create a Dot plot
ggplot(airquality, aes(x = factor(Month), fill = factor(Month),
                       y = Wind)) +
  geom_dotplot(binaxis = "y", stackdir = "center",
               color = "gold")
Change Colors of a R Dot Plot using Columns 2
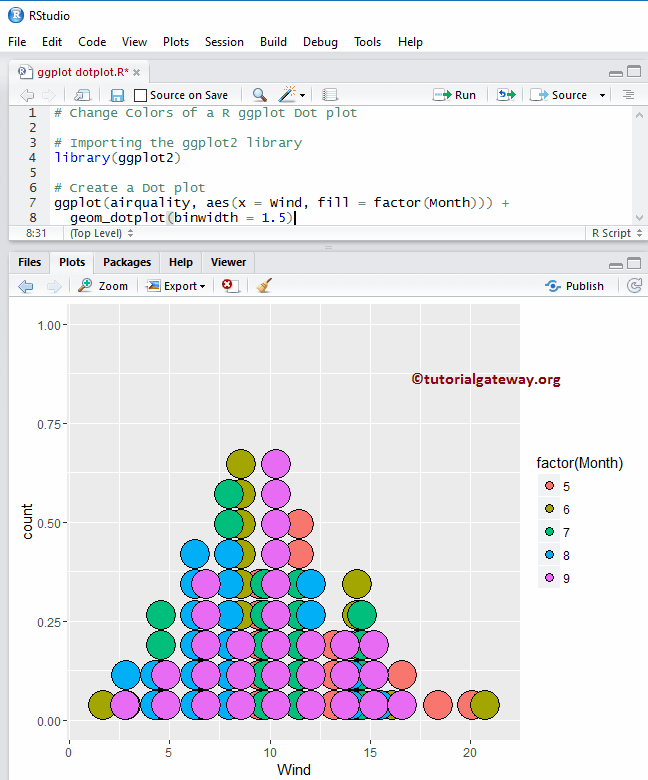
Here, we removed the y-axis of the R ggplot dotplot
# Change Colors of an ggplot Dot plot

# Importing the ggplot2 library
library(ggplot2)

# Create a Dot plot
ggplot(airquality, aes(x = Wind, fill = factor(Month))) +
  geom_dotplot(binwidth = 1.5)
Multiple groups in R ggplot2 Dot plot
In this R ggplot dotplot example, we show how to group multiple dot plots
- stackgroups: Please specify whether you want to stack the dots across groups or not.
- binpositions: When the method is “dotdensity”,
- and the binpositions = “bygroup” decide the positions of the bins for each group separately.
- binpositions = “all” determines the positions of the bins by taking all the data together. Therefore, we can use this for aligning dots across multiple groups.
# Multiple Groups in ggplot Dot plot

# Importing the ggplot2 library
library(ggplot2)

# Create a Dot plot
ggplot(airquality, aes(x = Wind, fill = factor(Month))) +
  geom_dotplot(binwidth = 1.0, stackgroups = TRUE, binpositions="all")

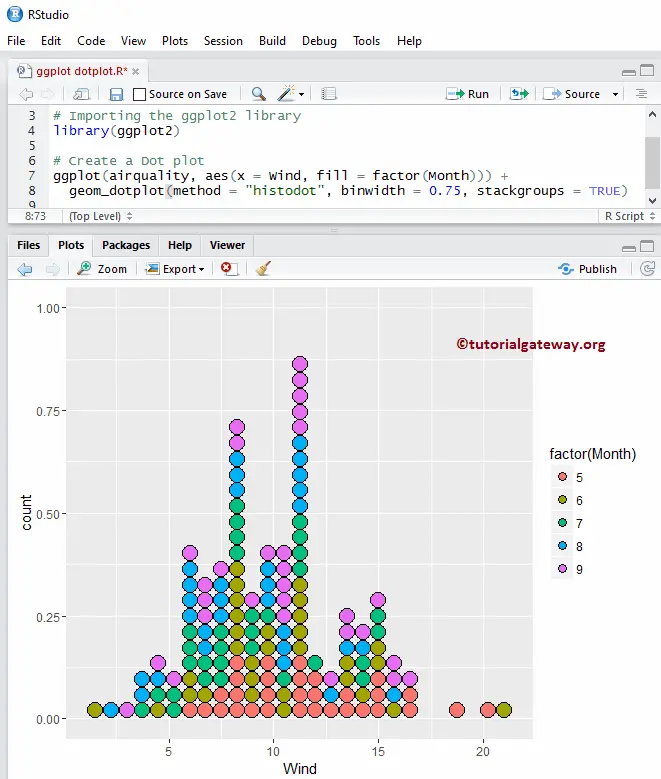
Multiple groups inggplot2 Dot plot 2
In this R ggplot dotplot example, we removed the binpositions argument from the geom_dotplot() function. We added the histodot value to the method argument.
# Multiple Groups in ggplot Dot plot

# Importing the ggplot2 library
library(ggplot2)

# Create a Dot plot
ggplot(airquality, aes(x = Wind, fill = factor(Month))) +
  geom_dotplot(method = "histodot", binwidth = 0.75, stackgroups = TRUE)
Assigning names to R ggplot Dot Plot
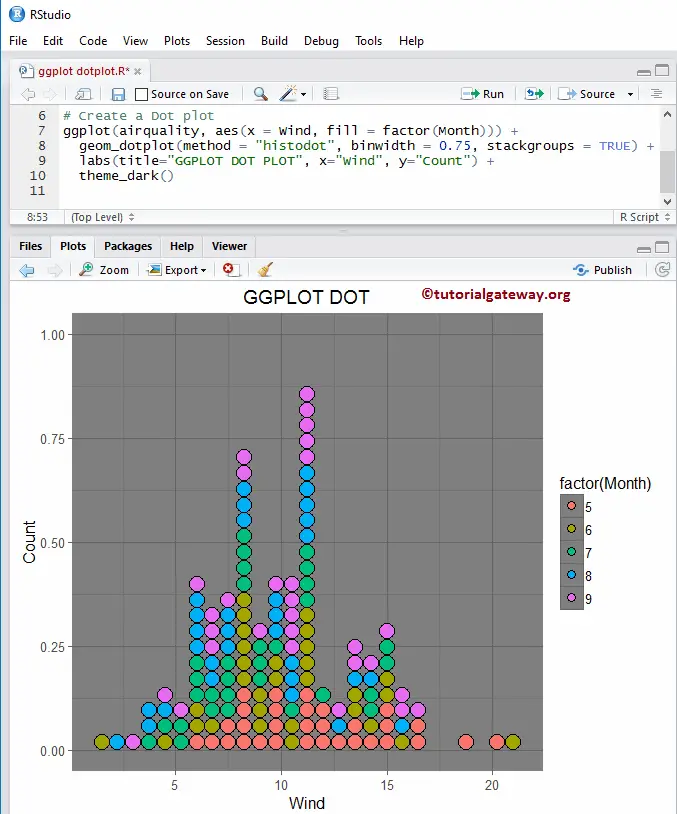
In this R ggplot dotplot example, we assign names to the ggplot dot plot, X-Axis, and Y-Axis using labs function, and change the default theme of a ggplot Dot Plot.
- theme_dark(): We use this function to change the R ggplot dotplot default theme to dark. If you type theme_, then R Studio intelligence shows the list of available options. For example, theme_grey()
# Multiple Groups in ggplot Dot plot

# Importing the ggplot2 library
library(ggplot2)

# Create a Dot plot
ggplot(airquality, aes(x = Wind, fill = factor(Month))) +
  geom_dotplot(method = "histodot", binwidth = 0.75, stackgroups = TRUE) +
  labs(title="GGPLOT DOT PLOT", x="Wind", y="Count") +
  theme_dark()