The SSRS Matrix report is similar to the table (tablix structure) with a row group and column group. A Matrix in SSRS is very helpful in displaying a numeric value against the multiple dimensions in crosstab reports. It means each value in the Matrix cell is a summary or aggregated value of row and column groups.
A table has dynamic rows (N rows) and fixed columns, whereas the SSRS Matrix has dynamic rows and columns. You can enable the Drill down option in the grouping properties to expand and shrink the columns or rows.
This article will show you how to create a Matrix Report in SSRS (SQL Server Reporting Services) with a practical example.
The below screenshot will show you the Data Source and Dataset we used to create this SSRS Matrix Report.
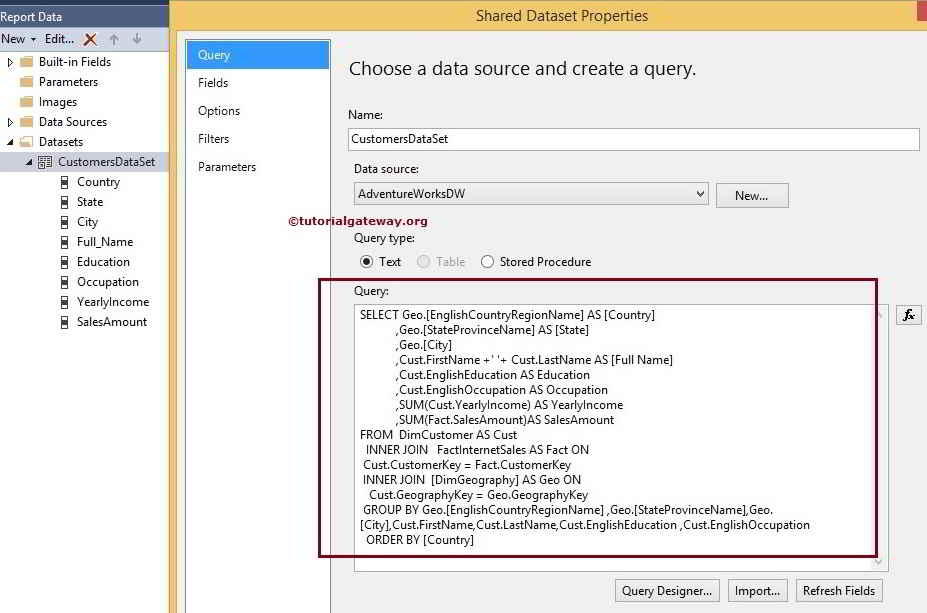
SQL Command we used for this SSRS Matrix Report in the above screenshot is:
SELECT Geo.[EnglishCountryRegionName] AS [Country]
      ,Geo.[StateProvinceName] AS [State]
      ,Geo.[City]
      ,Cust.FirstName +' '+ Cust.LastName AS [Full Name]
      ,Cust.EnglishEducation AS Education
      ,Cust.EnglishOccupation AS Occupation
      ,Cust.Gender
      ,SUM(Cust.YearlyIncome) AS YearlyIncome
      ,SUM(Fact.SalesAmount)AS SalesAmount
FROM  DimCustomer AS Cust
  INNER JOIN
      FactInternetSales AS Fact ON
 Cust.CustomerKey = Fact.CustomerKey
 INNER JOIN
     [DimGeography] AS Geo ON
   Cust.GeographyKey = Geo.GeographyKey
 GROUP BY Geo.[EnglishCountryRegionName]
         ,Geo.[StateProvinceName]
	 ,Geo.[City]
	 ,Cust.FirstName
         ,Cust.LastName
         ,Cust.EnglishEducation
         ,Cust.EnglishOccupation
         ,Cust.Gender
  ORDER BY [Country]
Creating Matrix without using Report Wizard in SSRS
Please refer to the Table Report to understand the creation of a basic Report. Then, drag and drop the Matrix report from the SSRS Toolbox to the Data region.
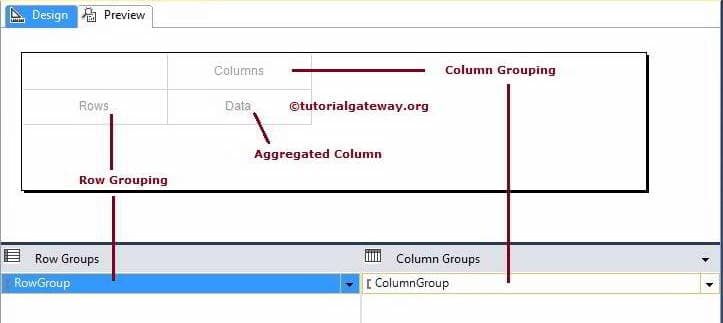
We can add the Column names to the SSRS Matrix report Grouping in three ways:
- We can Drag the Column name from the Report data to the Row Grouping or Column Grouping Column.
- Drag and Drop the Column name from the Report data to the Row Grouping Pane or Column Grouping Pane.
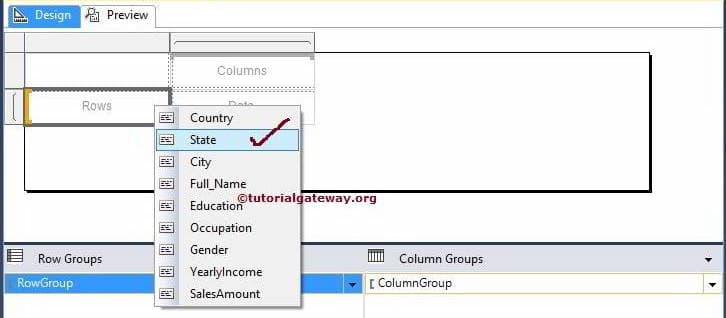
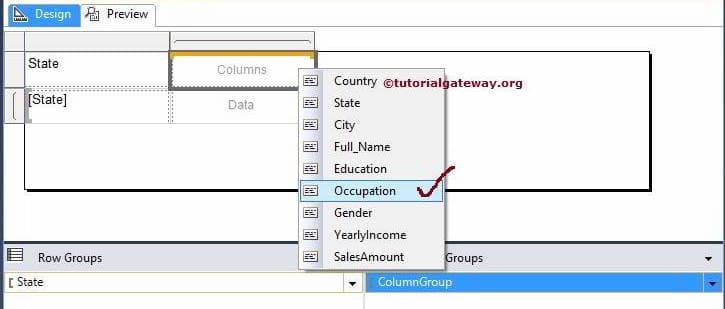
- When we click on a particular cell, it will open the context menu displaying available column names in that Dataset. We can select the required column from the list. Here we are selecting StateColumn as a Row Grouping item.
Now, we are choosing Occupation Column as a Column Grouping item.
Here, we are selecting the Sales Amount Column as a Data item.
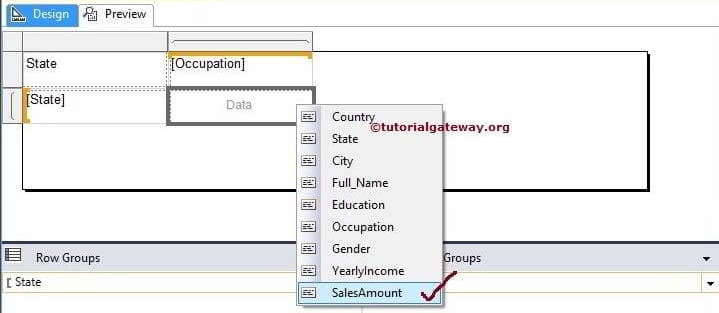
NOTE: When you add a Column to a Data Column, the Reporting Server will automatically aggregate the data. If you want to change the aggregate functions, go to fx Expression and adjust them accordingly.
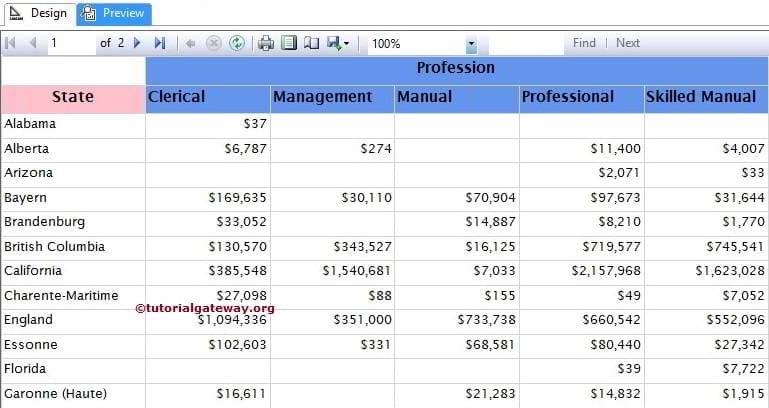
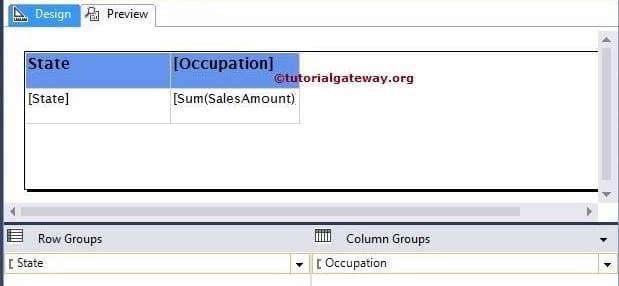
We successfully created our first SSRS Matrix report. If you observe the screenshot below, we have also done the formatting.
Please refer to the Format Fonts and Background Color of a Textbox article to understand them.
Click on the Preview button to see the report preview
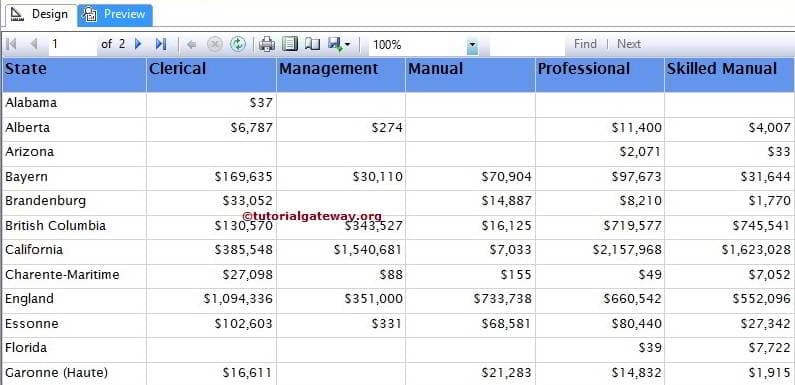
Add Header Column For Column Grouping in SSRS Matrix Report
If you observe the above screenshot, we all know that Clerical, Management, Manual, etc., are Customer Occupations. What if we don’t know or want to provide extra information to the user about each column? In these situations, we must add a row (containing the Header Details of the columns).
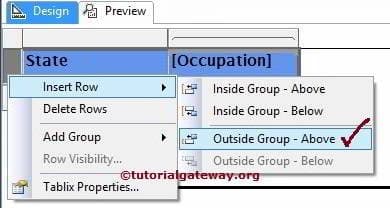
To add a new row to SSRS Matrix Report, select the Header column of a report and then right-click on it to open the context menu. From the menu, Please select the Insert Row option. Here we have multiple options, and their functionalities are:
- Inside Group – Above: This option inserts a new row on top of the Header column and inside the Group. Inside the Group means Header text will repeat for every row
- Inside Group – Below: This option will insert a new row below the Header column and inside the Group.
- Outside Group – Above: It inserts a new row on top of the Header column and Outside the Group. Outside the Group means the Header text will be static and will not repeat for every row.
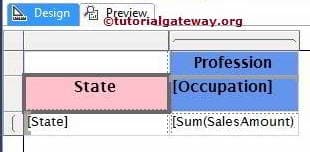
We named the Header text Profession, as shown below
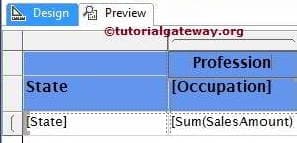
If you observe the below screenshot, we have done the background formatting.
Click on the Preview button to see the SSRS Matrix Report preview.