
How to create a new QlikView report using a wizard with screenshots?. For the demonstration purpose, we create a Bar Chart, along with Table Box, using this QlikView Report Wizard.
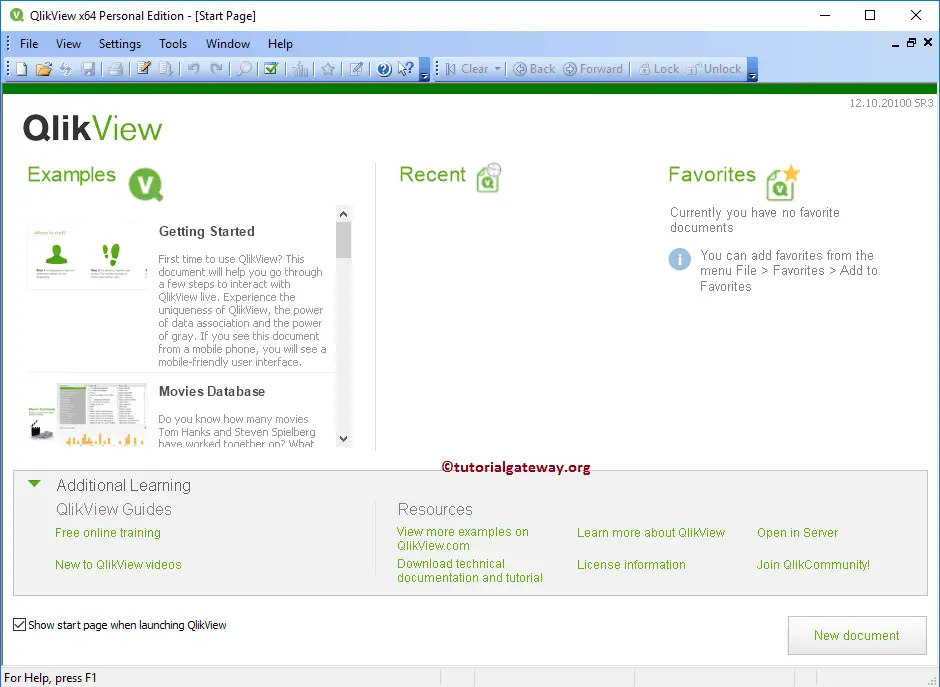
If you are running on Windows 7 or later find the application in start -> All Programs -> QlikView Folder -> QlikView. Double click on the QlikView 12 (In your case, version might be different) tool. It opens the QlikView Personal Edition. The first page is the Start page, and do not want to see this page again, Please unchecked the show the Start page when launching the QlikView option.
Create New QlikView Report Using Wizard
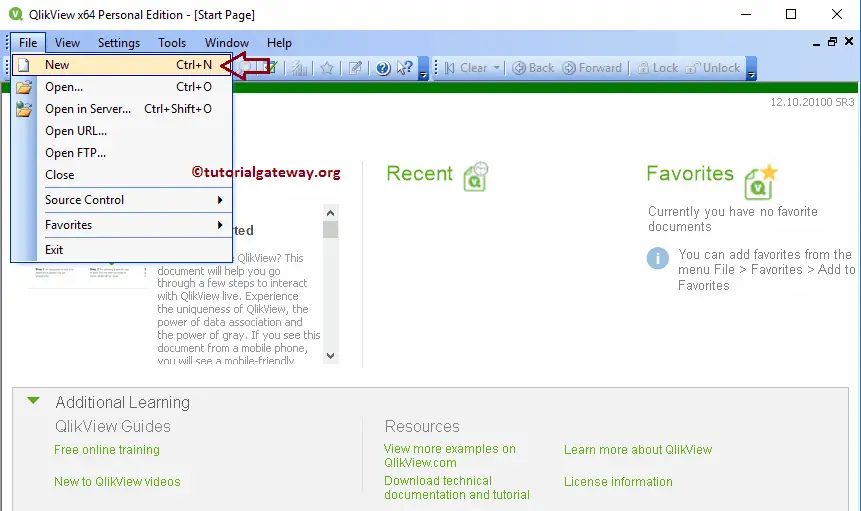
We can create a New QlikView Report in multiple ways: Please navigate to File Menu, and then select the New option (or click Ctrl + N).
Alternatively, click on the New document shortcut present in the QlikView toolbar.
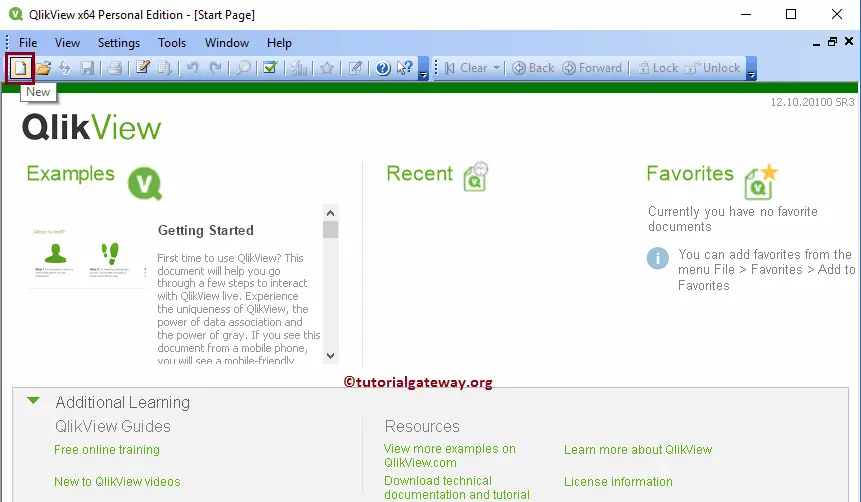
Either way, it opens a New Wizard that helps to create a new QlikView report using a wizard.
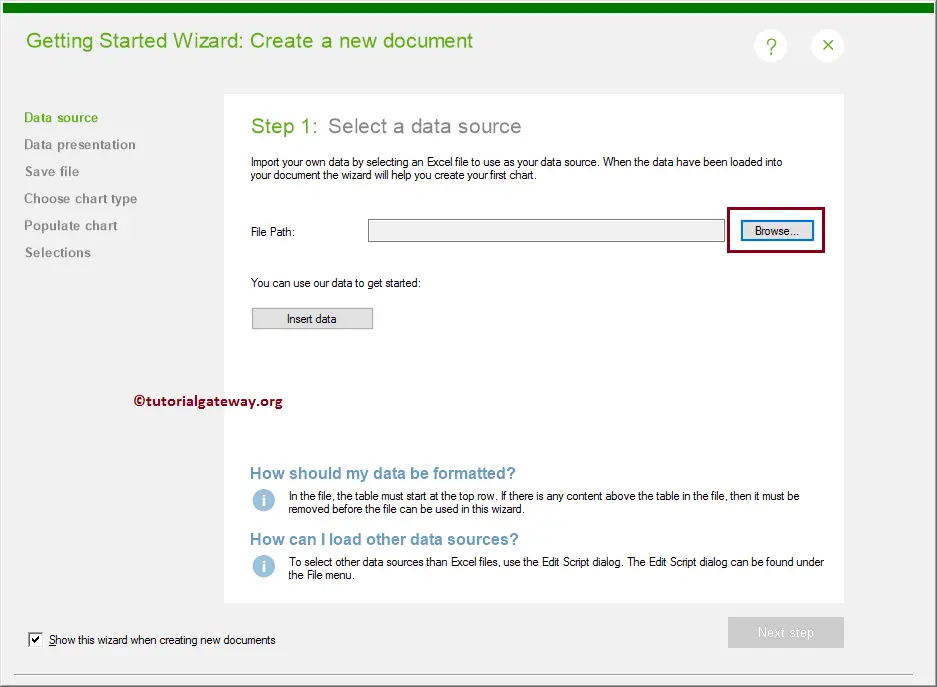
Step 1: Data Source
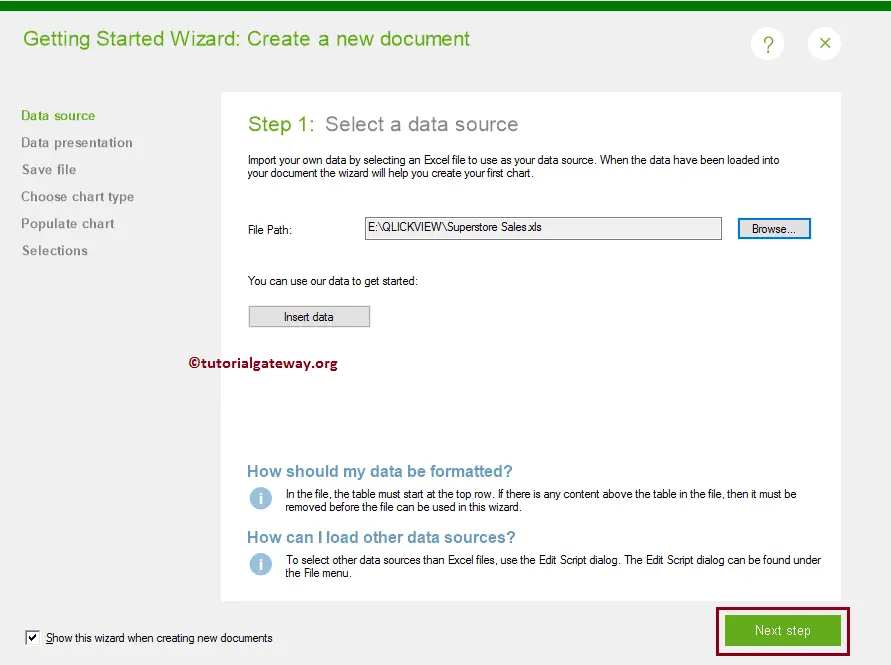
Use this page to add the data source to use in this report. Here we want to work with the Excel File. So, we are clicking the Browse button to navigate the file system.
Clicking the Browse button opens the list of files available in the documents folder. Please navigate to the folder where you saved data. From the below, see that we are selecting the Excel file by clicking the Open button.
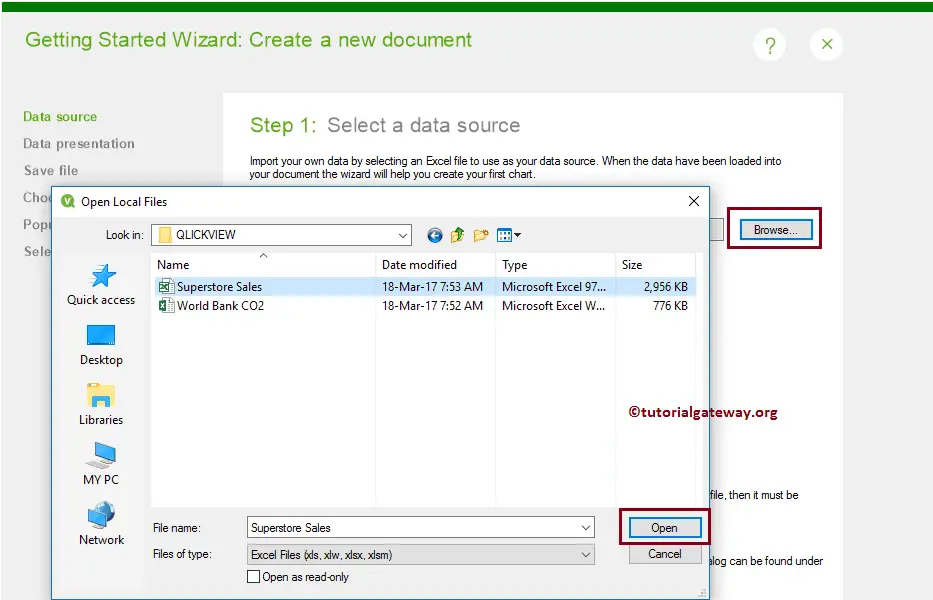
Click the Next Step button
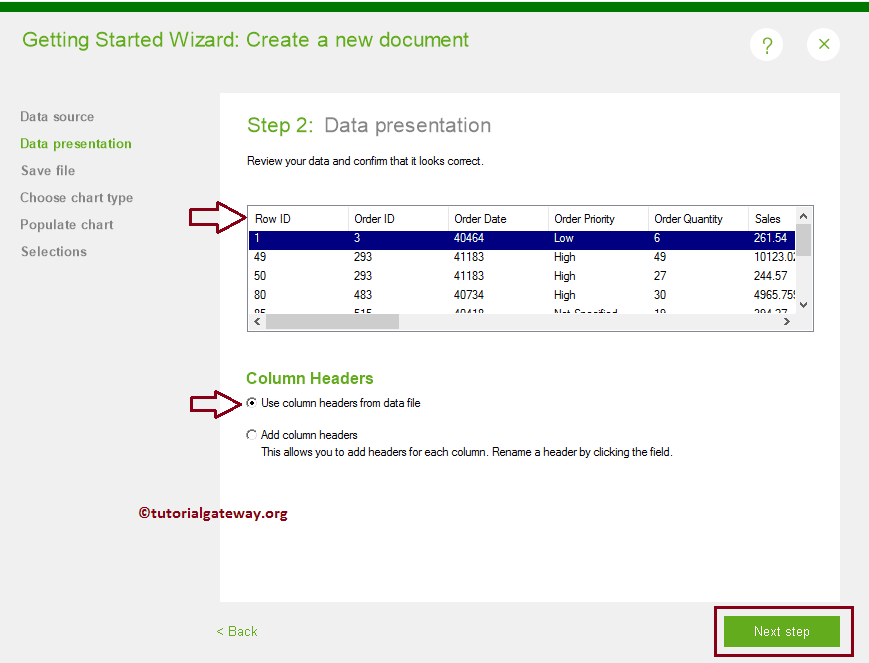
Step 2: Data Presentation
This page is useful to review loaded data, and if it looks correct, then confirm it; otherwise, modify it. This page has two options under the Column Headers:
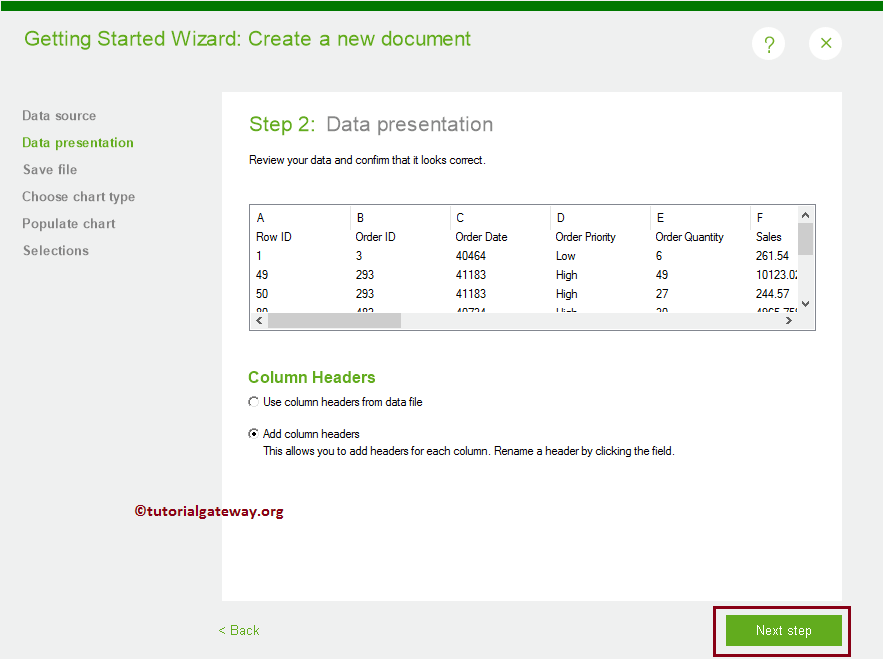
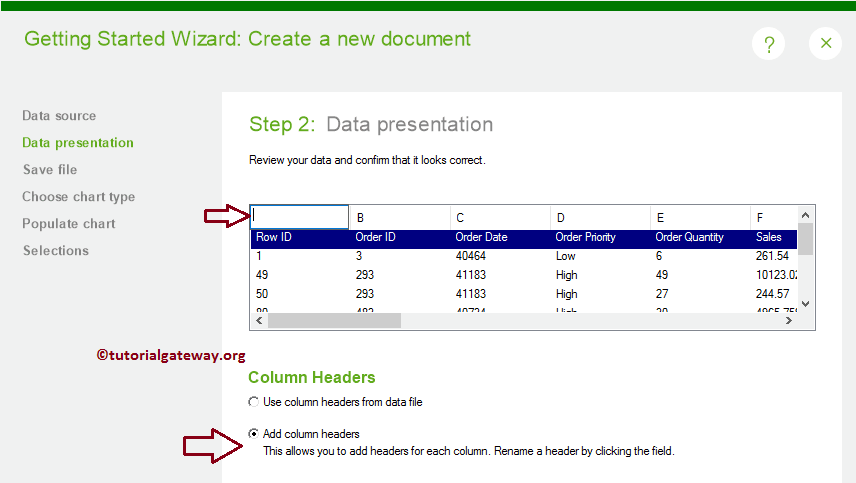
Add Column Headers: This option allows adding headers to each column. Click on the fields to rename the header from default alphabets (A, B, C..) to a more meaningful name. If data does not have any Column headers, then select this option.
Use Column Headers from Data File: If an Excel file includes a column name in the first row, then select this option. By selecting this option, QlikView automatically assigns the first row data to column headers.
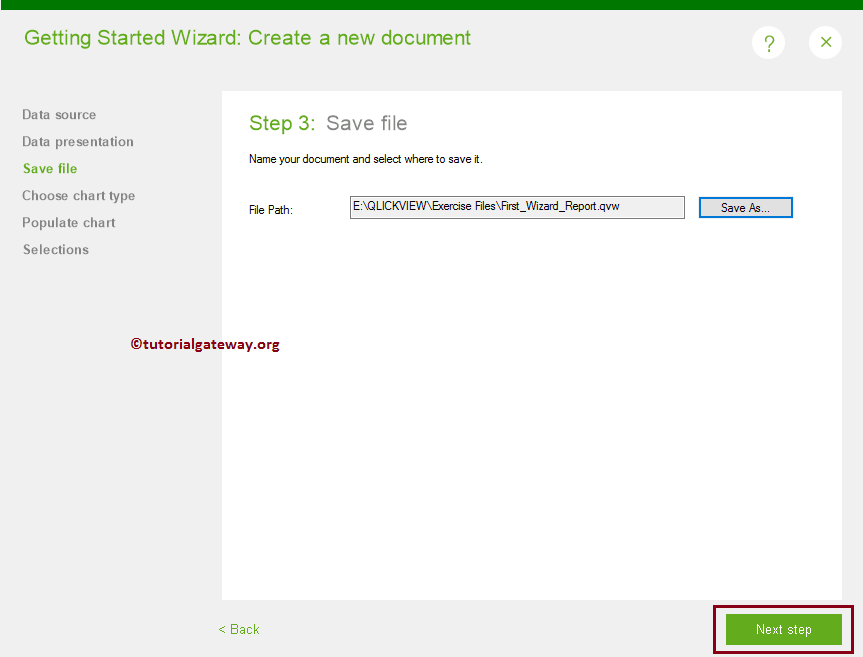
Step 3: Save File
Clicking the Next Step button opens the Save file page along with the Save As a pop-up window to save the file. If not opened, then click on the Save as button present on this page.
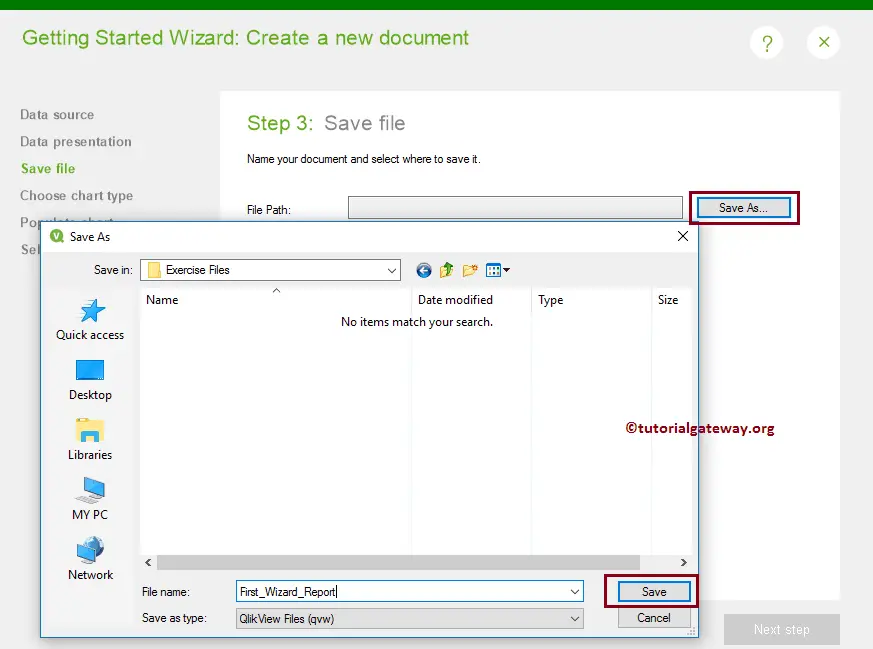
From the screenshot below, see that we are saving the report as First_Wizard_Report.
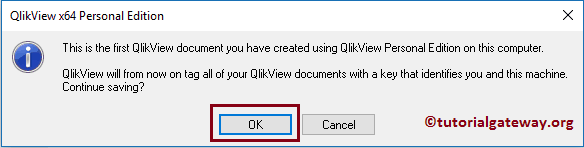
If you are creating the first report, then this message appears; otherwise, it won’t. Anyways, if you find this message, then click the Ok button
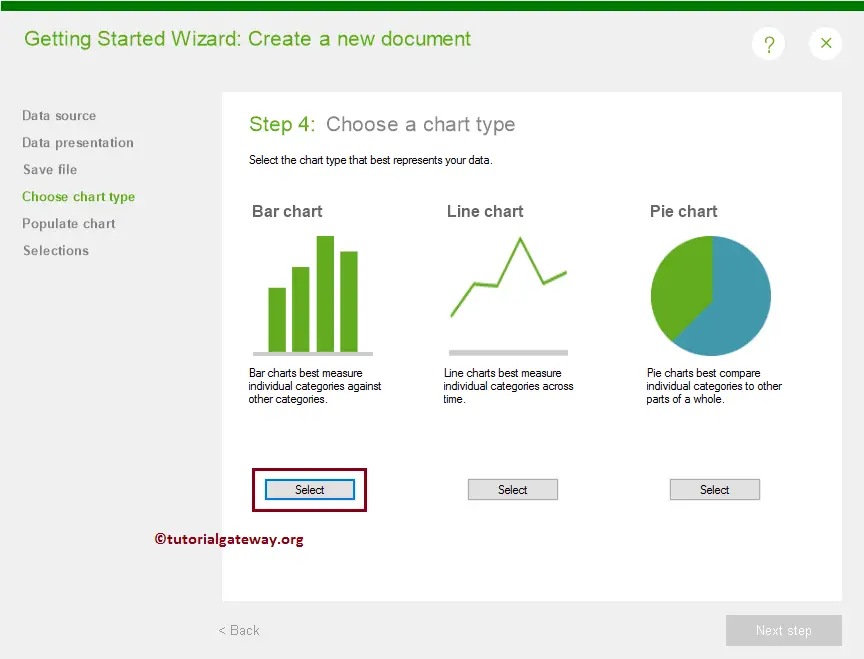
Step 4: Choose Chart Type
This page is useful to select the chart type. It provides three options: Bar Chart, Line Chart, and Pie Chart. Please select the chart type to design. For example, to design a Bar Chart, select the Bar Chart option by clicking the Select button.
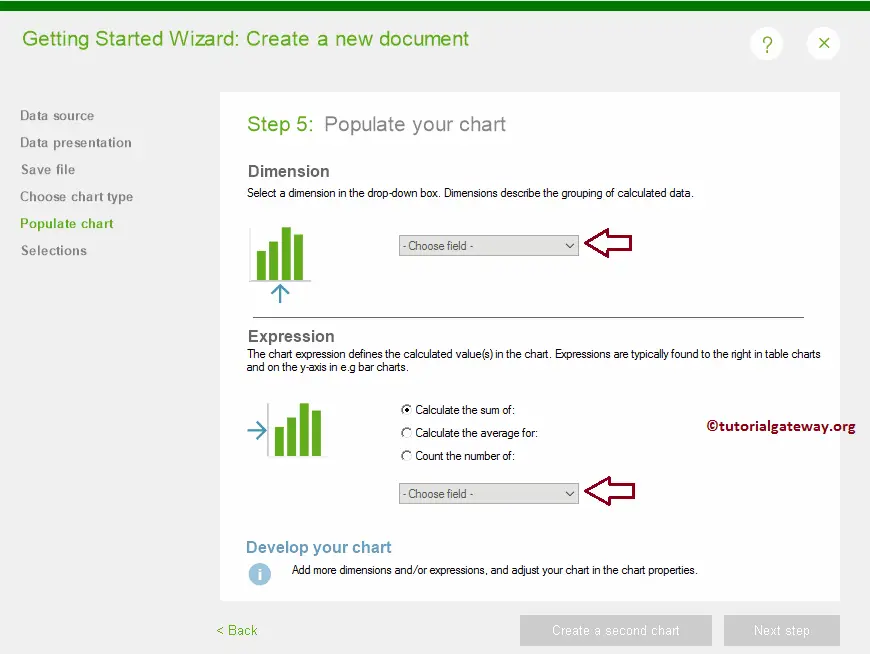
Step 5: Populate your Chart
Next, we have to populate or assign data for our bar chart. As we know, the QlikView bar chart requires one X-Axis value and Y-Axis value.
- Dimension: Select the Column to use as X-Axis. Mostly we use the Dimension data as something like Category, Color, State, City, Country, Region, etc. QlikView provides a drop-down box to select the Column name for Dimensional data
- Expression: Here, select the Column to use as Y-Axis. Mostly Numeric data and it should aggregate as Sum, Average, or Count.
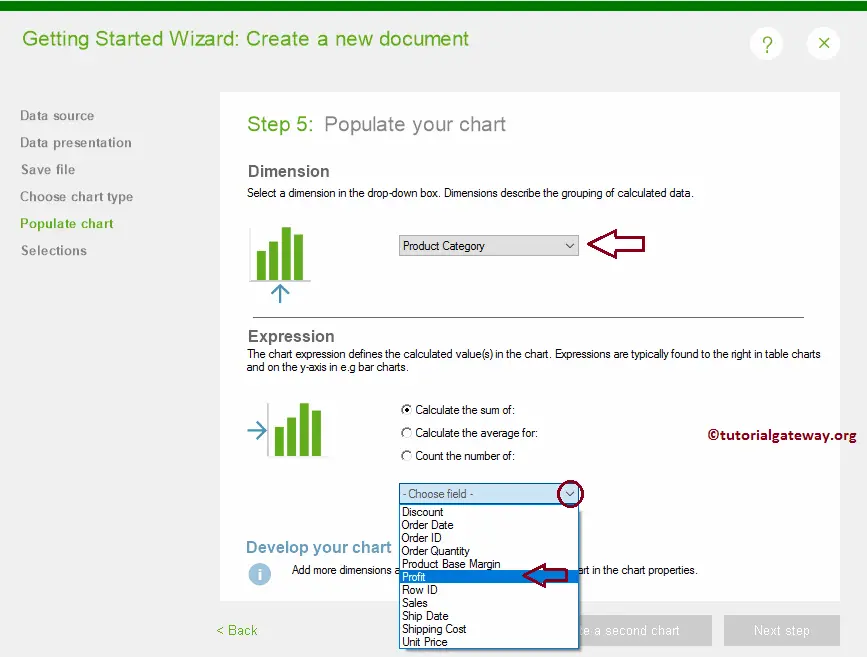
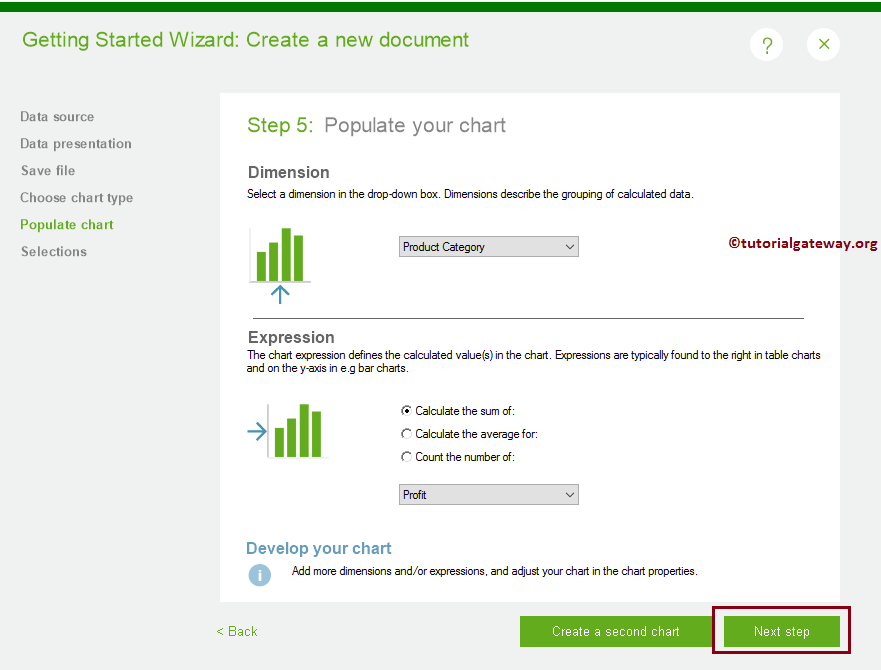
From the screenshot below, see that we selected the product category as the Dimension data, and Sum of Profits as the Expression. Remember, we have only 3 product categories in our excel file.
After finish selecting or populating data for the bar chart, Please Click on the Next Step button.
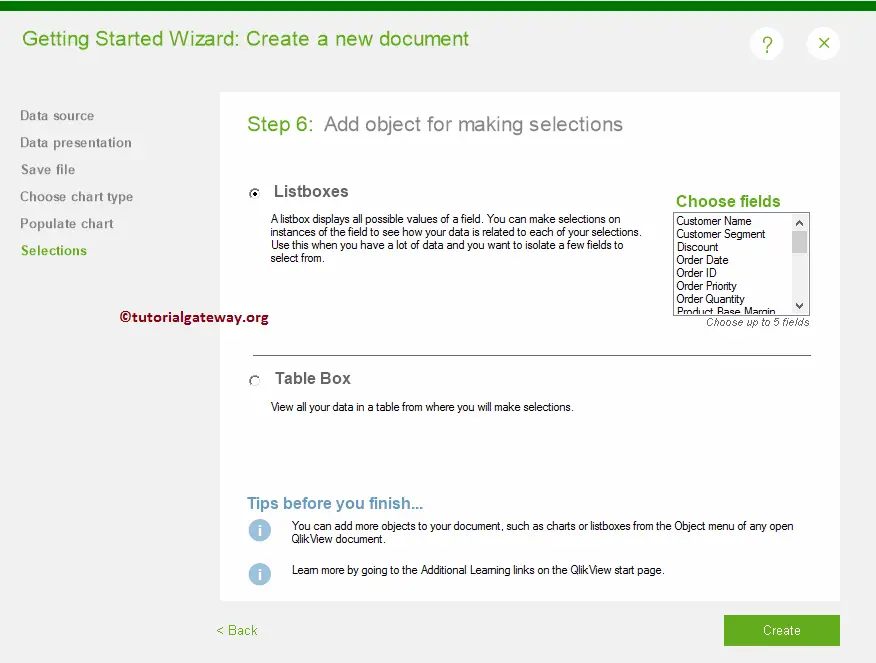
Step 6: Add Object for making Selection
This page allows adding either List boxes, or Table Box. Use this box as a filter. It means select any item alters the data present in our bar chart. It is too early to tell about all those things. So, focus on report creating only
For now, we are selecting the table Box
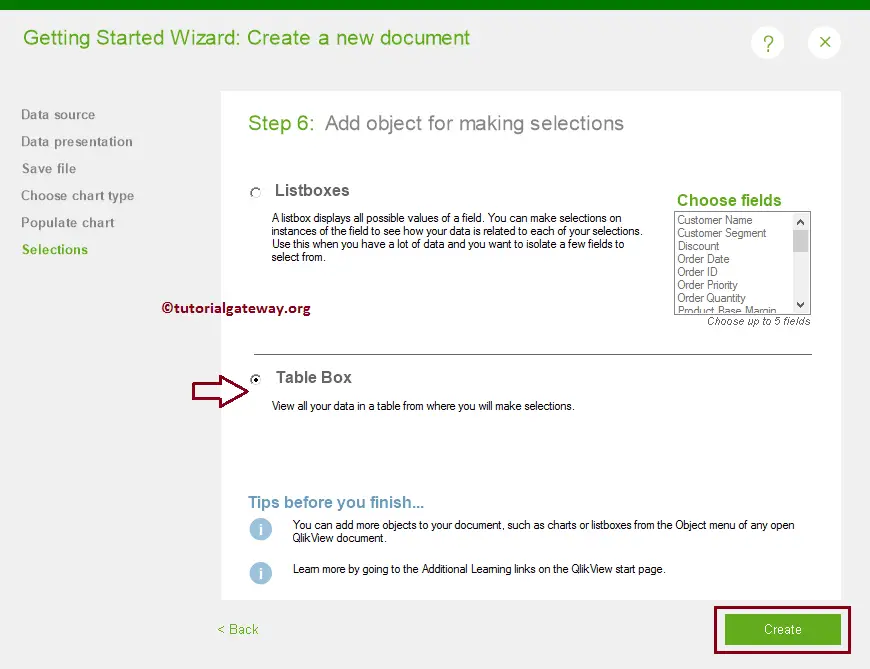
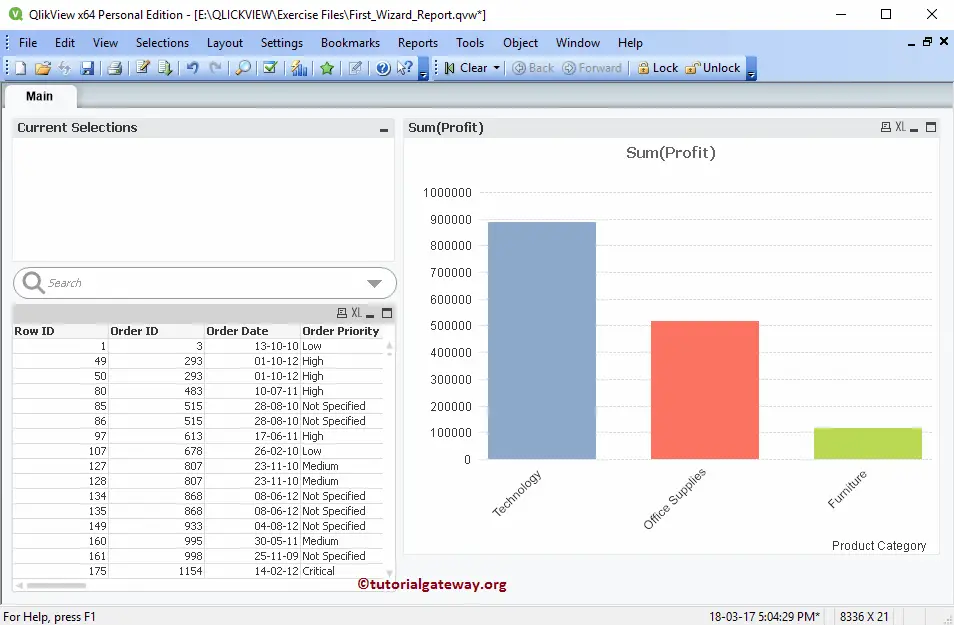
Clicking the Create Button, QlikView create a new report. From the screenshot below, see it is displaying the Bar Chart with Product category on the X-Axis, and Sum of Profits on the Y-Axis. Moreover, the Table box is displaying all the rows and columns available in the Excel file.
Hope understood the steps by step approach to create a new QlikView report using a wizard.